Page 102 - eProceeding - IRSTC & RESPEX 2017
P. 102

Syamsul Anuar  / JOJAPS – JOURNAL ONLINE JARINGAN COT POLIPD

                                           ASPRS 1990 Class   ASPRS 1990 Class   ASPRS 1990 Class
                        Contour Interval
                             (Feet)       1 Limiting RMSEz    2 Limiting RMSEz   3 Limiting RMSEz
                                                (Feet)             (Feet)              (Feet)
                               1                0.333               0.667               1.0
                               2                0.667               1.333               2.0
                               4                1.333               2.667               4.0
                               5                1.667               3.333               5.0
                                                    1 Feet = 0.304 meter


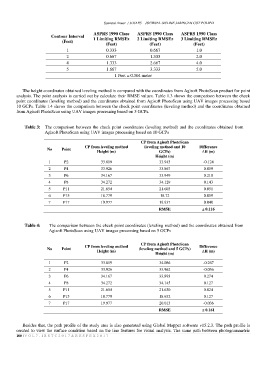
           The height coordinates obtained leveling method is compared with the coordinates from Agisoft PhotoScan product for point
        analysis. The point analysis is carried out by calculate their RMSE values. Table 1.3 shows the comparison between the check
        point coordinates (leveling method) and the coordinates obtained from Agisoft PhotoScan using UAV images processing based
        10 GCPs. Table 1.4 shows the comparison between the check point coordinates (leveling method) and the coordinates obtained
        from Agisoft PhotoScan using UAV images processing based on 5 GCPs.


            Table 3:   The comparison between the check point coordinates (leveling method) and the coordinates obtained from
                     Agisoft PhotoScan using UAV images processing based on 10 GCPs

                                                                CP from Agisoft PhotoScan
                                       CP from leveling method   (leveling method and 10   Difference
                      No    Point
                                            Height (m)                  GCPs)              ∆H (m)
                                                                      Height (m)
                       1      P2              33.819                    33.943             -0.124
                       2      P4              33.926                    33.867              0.059
                       3      P6              34.167                    33.949              0.218
                       4      P8              34.272                    34.129              0.143
                       5     P11              21.654                    21.603              0.051
                       6     P15              18.779                    18.72               0.059
                       7     P17              19.977                    19.937              0.040
                                                                        RMSE               ± 0.116


            Table 4:    The comparison between the check point coordinates (leveling method) and the coordinates obtained from
                       Agisoft PhotoScan using UAV images processing based on 5 GCPs

                                                                CP from Agisoft PhotoScan
                                       CP from leveling method                            Difference
                      No    Point                              (leveling method and 5 GCPs)
                                            Height (m)                                     ∆H (m)
                                                                      Height (m)
                       1      P2              33.819                    34.086             -0.267
                       2      P4              33.926                    33.962             -0.036
                       3      P6              34.167                    33.893              0.274
                       4      P8              34.272                    34.145              0.127
                       5     P11              21.654                    21.630              0.024
                       6     P15              18.779                    18.652              0.127
                       7     P17              19.977                    20.013             -0.036
                                                                        RMSE               ± 0.161


           Besides that, the path profile of the study area is also generated using Global Mapper software v15.2.3. The path profile is
        created to view the surface condition based on the line features for visual analysis. The same path between photogrammetric
        100 | V O L 7 - I R S T C 2 0 1 7 & R E S P E X 2 0 1 7
   97   98   99   100   101   102   103   104   105   106   107