
Page 103 - eProceeding - IRSTC & RESPEX 2017
P. 103
Syamsul Anuar / JOJAPS – JOURNAL ONLINE JARINGAN COT POLIPD
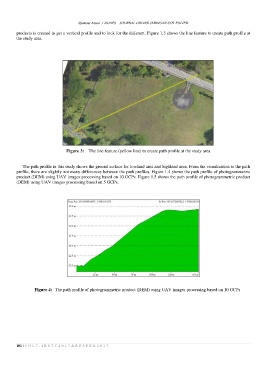
products is created to get a vertical profile and to look for the different. Figure 1.3 shows the line feature to create path profile at
the study area.
Figure 3: The line feature (yellow line) to create path profile at the study area
The path profile in this study shows the ground surface for lowland area and highland area. From the visualization to the path
profile, there are slightly not many differences between the path profiles. Figure 1.4 shows the path profile of photogrammetric
product (DEM) using UAV images processing based on 10 GCPs. Figure 1.5 shows the path profile of photogrammetric product
(DEM) using UAV images processing based on 5 GCPs.
Figure 4: The path profile of photogrammetric product (DEM) using UAV images processing based on 10 GCPs
101 | V O L 7 - I R S T C 2 0 1 7 & R E S P E X 2 0 1 7