
Page 248 - rise 2017
P. 248
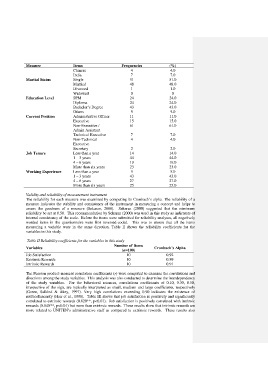
Measure              Items                Frequencies          (%)
                                  Chinese                  4                 4.0
                                  India                    7                 7.0
             Marital Status       Single                   51               51.0
                                  Married                  48               48.0
                                  Divorced                 1                 1.0
                                  Widowed                  0                 0
             Education Level      SPM                      24               24.0
                                  Diploma                  24               24.0
                                  Bachelor’s Degree        43               43.0
                                  Others                   9                 9.0
             Current Position     Administrative Officer   11               11.0
                                  Executive                15               15.0
                                  Non-Executive /          61               61.0
                                  Admin Assistant
                                  Technical Executive      7                 7.0
                                  Non-Technical            4                 4.0
                                  Executive
                                  Secretary                2                 2.0
             Job Tenure           Less than a year         14               14.0
                                  1 – 3 years              44               44.0
                                  4 – 6 years              19               19.0
                                  More than six years      23               23.0
             Working Experience   Less than a year         5                 5.0
                                  1 – 3 years              43               43.0
                                  4 – 6 years              27               27.0
                                  More than six years      25               25.0

             Validity and reliability of measurement instrument
             The reliability for each measure was examined by computing its Cronbach’s alpha. The reliability of a
             measure indicates the stability and consistency of the instrument in measuring a concept and helps to
             assess  the  goodness  of  a  measure  (Sekaran,  2000).    Sekaran  (2000)  suggested  that  the  minimum
             reliability be set at 0.50.  This recommendation by Sekaran (2000) was used in this study as indicators of
             internal consistency of the scale.  Before the items were submitted for reliability analyses, all negatively
             worded  items  in  the  questionnaire  were  first  reversed-coded.    This  was  to  ensure  that  all  the  items
             measuring  a  variable  were  in  the  same  direction.  Table  II  shows  the  reliability  coefficients  for  the
             variables in this study.

              Table II Reliability coefficients for the variables in this study
                                                    Number of Items
             Variables                                                Cronbach’s Alpha
                                                       (n=100)
             Job Satisfaction                            10                0.92
             Extrinsic Rewards                           10                0.89
             Intrinsic Rewards                           10                0.91

             The Pearson product-moment correlation coefficients (r) were computed to examine the correlations and
             directions among the study variables.  This analysis was also conducted to determine the interdependency
             of  the  study  variables.    For  the  behavioral  sciences,  correlations  coefficients  of  0.10,  0.30,  0.50,
             irrespective of the sign, are typically interpreted as small, medium and large coefficients, respectively
             (Green,  Salkind  &  Akey,  1997).  Very  high  correlations  exceeding  0.90  indicates  the  existence  of
             multicollinearity (Hair et al., 1998).  Table III shows that job satisfaction is positively and significantly
             correlated to extrinsic rewards (0.820**, p<0.01).  Job satisfaction is positively correlated with intrinsic
             rewards (0.840**, p<0.01) but more than extrinsic rewards.  These results show that intrinsic rewards are
             more  related  to  UNITEN’s  administrative  staff  as  compared  to  extrinsic  rewards.    These  results  also