
Page 51 - Futr Investment Proposal
P. 51
51
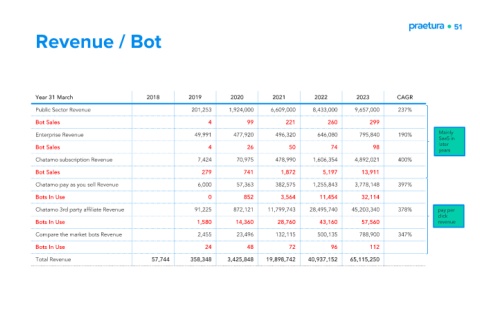
Revenue / Bot
Year 31 March 2018 2019 2020 2021 2022 2023 CAGR
Public Sector Revenue 201,253 1,924,000 6,609,000 8,433,000 9,657,000 237%
Bot Sales 4 99 221 260 299
Enterprise Revenue 49,991 477,920 496,320 646,080 795,840 190% Mainly
SaaS in
later
Bot Sales 4 26 50 74 98
years
Chatamo subscription Revenue 7,424 70,975 478,990 1,606,354 4,892,021 400%
Bot Sales 279 741 1,872 5,197 13,911
Chatamo pay as you sell Revenue 6,000 57,363 382,575 1,255,843 3,778,148 397%
Bots In Use 0 852 3,564 11,454 32,114
Chatamo 3rd party affiliate Revenue 91,225 872,121 11,799,743 28,495,740 45,203,340 378% pay per
click
Bots In Use 1,580 14,360 28,760 43,160 57,560 revenue
Compare the market bots Revenue 2,455 23,496 132,115 500,135 788,900 347%
Bots In Use 24 48 72 96 112
Total Revenue 57,744 358,348 3,425,848 19,898,742 40,937,152 65,115,250