
Page 14 - FY 2025 NRR Annual Report
P. 14
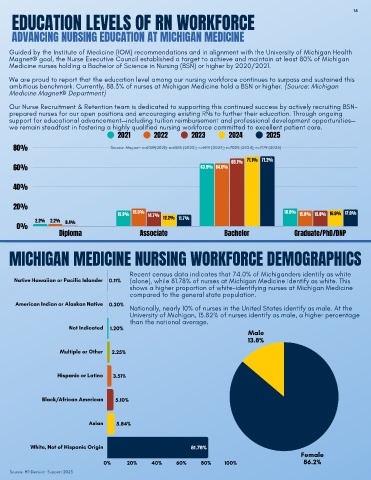
EDUCATION LEVELS OF RN WORKFORCE                                                                                 14


     ADVANCING NURSING EDUCATION AT MICHIGAN MEDICINE

    Guided by the Institute of Medicine (IOM) recommendations and in alignment with the University of Michigan Health
    Magnet® goal, the Nurse Executive Council established a target to achieve and maintain at least 80% of Michigan
    Medicine nurses holding a Bachelor of Science in Nursing (BSN) or higher by 2020/2021.
    We are proud to report that the education level among our nursing workforce continues to surpass and sustained this
    ambitious benchmark. Currently, 88.3% of nurses at Michigan Medicine hold a BSN or higher. (Source: Michigan
    Medicine Magnet® Department)

    Our Nurse Recruitment & Retention team is dedicated to supporting this continued success by actively recruiting BSN-
    prepared nurses for our open positions and encouraging existing RNs to further their education. Through ongoing
    support for educational advancement—including tuition reimbursement and professional development opportunities—
    we remain steadfast in fostering a highly qualified nursing workforce committed to excellent patient care.
                                        2021        2022        2023        2024         2025
     80%                             Source: Magnet: n=6089(2021); n=6583 (2022); n=6901 (2023); n=7025 (2024); n=7179 (2025)


                                                                             69.1%  71.1% 71.2%
     60%                                                           63.9% 64.0%

     40%


     20%
                                        15.9%  18.0%  14.7%                                    18.0%  15.8% 15.8% 16.6% 17.0%
             2.2%  2.2%  0.4%                          12.2% 11.7%
       0%
                     Diploma                   Associate                   Bachelor               Graduate/PhD/DNP

   OUR NURSING WORKFORCE CONTINUES TO STRENGTHEN
    MICHIGAN MEDICINE NURSING WORKFORCE DEMOGRAPHICS


                                            Recent census data indicates that 74.0% of Michiganders identify as white
      Native Hawaiian or Pacific Islander  0.11%  (alone), while 81.78% of nurses at Michigan Medicine identify as white. This
                                            shows a higher proportion of white-identifying nurses at Michigan Medicine
                                            compared to the general state population.
      American Indian or Alaskan Native  0.20%
                                            Nationally, nearly 10% of nurses in the United States identify as male. At the
                                            University of Michigan, 13.82% of nurses identify as male, a higher percentage
                                            than the national average.
                        Not Indicated  1.20%
                                                                                   Male
                                                                                   13.8%

                     Multiple or Other  2.25%


                    Hispanic or Latino  3.51%


               Black/African American  5.10%


                              Asian    5.84%


           White, Not of Hispanic Origin                        81.78%
                                                                                                    Female
                                   0%      20%     40%     60%     80%     100%                      86.2%
    Source: HR Decision Support 2025