
Page 84 - ASBIRES-2017_Preceedings
P. 84
Jothirathne & Deegahawature
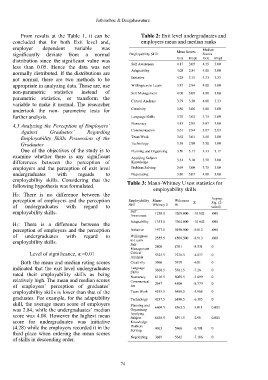
From results at the Table 1, it can be Table 2: Exit level undergraduates and
concluded that for both Exit level and, employers mean and median ranks
employer dependent variable was Median
significantly deviate from a normal Employability Skill Mean Scores Scores
distribution since the significant value was Exit Empl Exit Empl
less than 0.05. Hence the data was not Self Awareness 4.17 3.05 4.25 3.00
normally distributed. If the distributions are Adaptability 4.08 2.84 4.00 3.00
not normal, there are two methods to be Initiative 4.28 3.15 4.33 3.33
appropriate in analyzing data. Those are, use Willingness to Learn 3.87 2.94 4.00 3.00
non-parametric statistics instead of Self Management 4.08 3.09 4.00 3.00
parametric statistics, or transform the Critical Analysis 3.79 3.30 4.00 3.33
variable to make it normal. The researcher
undertook the non- parametric tests for Creativity 3.80 3.06 4.00 3.00
further analysis. Language Skills 3.70 3.02 3.75 3.00
4.3 Analyzing the Perception of Employers’ Numeracy 3.45 2.98 3.67 3.00
Against Graduates’ Regarding Communication 3.61 2.94 3.67 2.83
Employability Skills Possession of the Team Work 3.62 3.01 3.50 3.00
Although it seems that the differences
3.56
2.90
Graduates were existing, it had to be measure
Technology
3.00
3.50
One of the objectives of the study is to statistically, whether the differences were
3.17
3.50
3.33
Planning and Organizing
3.17
examine whether there is any significant significant or not. To check that, for each
Applying Subject
differences between the perception of Knowledge 3.54 3.10 3.50 3.00
employers and the perception of exit level individual skill, conducted the Mann
3.69
Problem Solving
3.75
3.00
3.00
undergraduates with regards to Whitney U test. 3.80 3.07 4.00 3.00
Negotiating
employability skills. Considering that the Table 3: Mann-Whitney U test statistics for
following hypothesis was formulated.
employability skills
H0: There is no difference between the
perception of employers and the perception Employability Mann- Wilcoxon Z Asymp.
Sig. (2-
of undergraduates with regard to Skill Whitney U W tailed)
employability skills. Self 1256.0 3209.000 -10.802 .000
Awareness
H1: There is a difference between the Adaptability 1351.0 3304.000 -10.642 .000
perception of employers and the perception Initiative 1977.5 3930.500 -9.812 .000
of undergraduates with regard to Willingness 2555.5 4508.500 -8.913 .000
employability skills. to Learn
Self
Management 2808 4761 -8.531 0
Level of significance, α =0.01 Critical 5325.5 7278.5 -4.877 0
Analysis
Both the mean and median rating scores Creativity 3966 5919 -6.81 0
indicated that the exit level undergraduates Language 3628.5 5581.5 -7.26 0
rated their employability skills as being Skills 6116.5 8069.5 -3.699 0
Numeracy
relatively high. The mean and median scores Communicat
of employers’ perception of graduates’ ion 2547 4500 -8.779 0
employability skills is lower than that of the Team Work 4535.5 6488.5 -5.968 0
graduates. For example, for the adaptability Technology 4237.5 6190.5 -6.385 0
skill, the average mean score of employers Planning and
was 2.84, while the undergraduates’ median Organizing 6609.5 8562.5 -3.011 0.003
score was 4.08. However the highest mean Applying 6638.5 8591.5 -2.98 0.003
Subject
score for undergraduates was initiative Knowledge
(4.28) while the employers recorded it in the Problem 4013 5966 -6.701 0
third place when ordering the mean scores Solving
Negotiating 3689 5642 -7.186 0
of skills in descending order.
74