
Page 10 - 2015 Best Practices of Spectacle Lens Management
P. 10
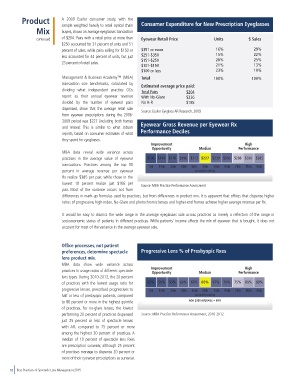
Product          A 2009 Essilor  consumer  study, with the   Consumer Expenditure for New Prescription Eyeglasses

                Mix        sample weighted heavily to retail optical chain
                           buyers, shows an average eyeglasses transaction
                continued  of $204. Pairs with a retail price at more than   Eyewear Retail Price  Units      $ Sales
                           $250 accounted for 31 percent of units and 51
                           percent of sales, while pairs selling for $150 or   $351 or more  16%           29%
                           less accounted for 44 percent of units, but just   $251-$350    15%             22%
                                                                                           26%
                                                                                                           25%
                           23 percent of retail sales.      $151-$250
                                                            $101-$150                      21%             13%
                                                            $100 or less                   23%             10%
                           Management & Business Academy™ (MBA)   Total                   100%            100%
                           transaction size benchmarks, calculated by   Estimated average price paid:
                           dividing what independent  practice ODs   Total Pairs  $204
                           report as their annual eyewear revenue   With No-Glare  $236
                           divided  by  the number of eyewear pairs   No A-R   $185
                           dispensed, show that the average retail sale
                                                            Source: Essilor Eyeglass AR Research, 2009
                           from  eyewear  prescriptions  during  the  2006-
                           2009 period was $227 (including both frames
                           and lenses).  This is similar to what Jobson   Eyewear Gross Revenue per Eyewear Rx
                           reports, based on consumer estimates of what   Performance Deciles
                           they spend for eyeglasses.
                                                                Improvement                            High
                                                                Opportunity         Median           Performance
                           MBA data reveal wide variance across
                           practices in the average value of eyewear   $106 $149 $176 $196 $213 $227 $239 $260 $288 $320 $385
                           transactions. Practices among the top 10     5th       15th       25th      35th     45th       50th       55th      65th      75th      85th      95th
                           percent in average revenue per eyewear                  percentile ranking
                           Rx realize $385 per pair, while those in the
                           lowest 10 percent realize just $106 per
                                                            Source: MBA Practice Performance Assessment
                           pair. Most of the variance occurs not from
                           differences in mark-up formulas used by practices, but from differences in product mix. It is apparent that offices that dispense higher
                           ratios of progressive, high-index, No-Glare and photochromic lenses and higher-end frames achieve higher average revenue per Rx.

                           It would be easy to dismiss the wide range in the average eyeglasses sale across practices as merely a reflection of the range in
                           socioeconomic status of patients in different practices. While patients’ income affects the mix of eyewear that is bought, it does not
                           account for most of the variance in the average eyewear sale.


                           Office processes, not patient
                           preferences, determine spectacle   Progressive Lens % of Presbyopic Rxes
                           lens product mix.
                           MBA data show wide variance across
                                                                                                       High
                           practices in usage ratios of different spectacle   Improvement   Median   Performance
                                                                Opportunity
                           lens types. During 2010-2012, the 20 percent
                           of practices with the lowest usage ratio for   35%  50%  53%  60%  63% 65%  67%  70%  75%  80%  89%
                           progressive lenses, prescribed progressives to     5th       15th       25th      35th      45th      50th       55th      65th      75th      85th      95th
                           half or less of presbyopic patients, compared           percentile ranking
                           to 80 percent or more in the highest quintile        AOA 2008 AVERAGE = 60%
                           of  practices.  For  no-glare  lenses,  the  lowest
                           performing 20 percent of practices dispensed   Source: MBA Practice Performance Assessment, 2010-2012
                           just 25 percent or less of spectacle lenses
                           with  AR, compared to 75 percent or more
                           among the highest 20 percent of practices. A
                           median of 10 percent of spectacle lens Rxes
                           are prescription sunwear, although 25 percent
                           of practices manage to dispense 20 percent or
                           more of their eyewear prescriptions as sunwear.

     10  Best Practices of Spectacle Lens Management 2015