Page 9 - 2015 Best Practices of Spectacle Lens Management
P. 9

Full-time
                                                                   Full-time
                                                                                Part-time
                                                                   Part-time
                                                                                                                                        % Contact Lens
                                                                                                                         % Contact Lens
                                                                                                                                        Patients
                                                                                                                         Patients
                                                                                                                                                     50%
                                                                                                                                     50%             35%
          Product                                                                                                                    35%             30%
                                                                                                                                     30%
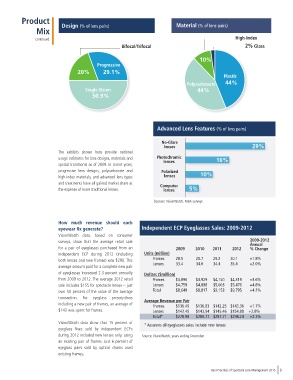
                Mix        Design (% of lens pairs)                        Material (% of lens pairs)                                25%             25%
                                                                                                                                                     20%
                continued                                                                          High-Index                        20%
                                                    Bifocal/Trifocal                                   2% Glass
                                                                                    10%
                                          Progressive
                                 20%        29.1%
                                                                                               Plastic
                                                                               Polycarbonate   44%
                                     Single Vision                                 44%
                                        50.9%


                                                                   Advanced Lens Features (% of lens pairs)

                                                                     No-Glare
                                                                      lenses                              29%
                         The exhibits shown here provide national
                         usage estimates for lens designs, materials and   Photochromic    16%
                                                                     lenses
                         special treatments as of 2009. In recent years,
                         progressive lens designs, polycarbonate and   Polarized
                         high-index materials, and advanced lens types   lenses      10%
                         and treatments have all gained market share at   Computer
                         the expense of more traditional lenses.     lenses     5%

                                                                 Sources: VisionWatch, MBA surveys


                         How much revenue should each
                         eyewear Rx generate?               Independent ECP Eyeglasses Sales: 2009-2012
                         VisionWatch data, based on consumer
                         surveys, show that the average retail sale                                      2009-2012
                                                                                                         Annual
                         for a pair of eyeglasses purchased from an       2009     2010   2011    2012   % Change

                         independent ECP during 2012 (including   Units (million)
                         both lenses and new frames) was $298. This   Frames  28.5  28.7  29.2   30.1    +1.8%
                         average amount paid for a complete new pair   Lenses  33.4  34.0  34.4  35.4    +2.0%
                         of eyeglasses increased 2.3 percent annually   Dollars ($million)
                         from 2009 to 2012. The average 2012 retail   Frames  $3,890  $3,929  $4,150  $4,319  +3.6%
                         sale includes $155 for spectacle lenses – just   Lenses  $4,759  $4,888  $5,003  $5,476  +4.8%
                         over 50 percent of the value of the average   Total  $8,649  $8,817  $9,153  $9,795  +4.2%
                         transaction. For eyeglass prescriptions   Average Revenue per Pair
                         including a new pair of frames, an average of   Frames   $136.49   $136.83  $142.25  $143.36    +1.7%
                         $143 was spent for frames.              Lenses   $142.49   $143.94  $145.46  $154.88    +2.8%
                                                                 Total*   $278.98   $280.77  $287.71  $298.24    +2.3%
                         VisionWatch data show that 15 percent of   * Assumes all eyeglasses sales include new lenses
                         eyeglass Rxes sold by independent ECPs
                         during 2012 included new lenses only, using   Source: VisionWatch, years ending December
                         an existing pair of frames. Just 6 percent of
                         eyeglass pairs sold by optical chains used
                         existing frames.


                                                                                         Best Practices of Spectacle Lens Management 2015  9
   4   5   6   7   8   9   10   11   12   13   14