
Page 22 - 2015 Best Practices of Spectacle Lens Management
P. 22
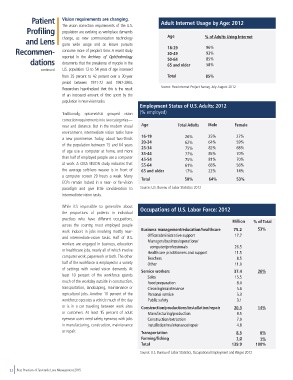
Patient      Vision requirements are changing.        Adult Internet Usage by Age: 2012                                 Patient

            Profiling      The vision correction requirements of the U.S.                                                           Profiling
                           population are evolving as workplace demands
            and Lens       change, as new communication technology     Age             % of Adults Using Internet                   and Lens
                           gains wide usage and as leisure pursuits
       Recommen-           consume more of people’s time. A recent study   18-29       96%                                      Recommen-
                                                                                       93%
                                                                       30-49
              dations      reported  in  the  Archives of Ophthalmology   50-64        85%                                            dations
                           documents that the prevalence of myopia in the
                                                                                       58%
                                                                       65 and older
                  continued  U.S. population 12 to 54 years of age increased
                           from 25 percent to 42 percent over a 30-year   Total        85%
                           period between 1971-72 and 1997-2004.
                           Researchers hypothesized that this is the result   Source: Pew Internet Project Survey, July-August 2012
                           of an increased amount of time spent by the
                           population in near-vision tasks.
                                                           Employment Status of U.S. Adults: 2012
                           Traditionally,  optometrists  grouped  vision   (% employed)
                           correction requirements into two categories—
                           near and distance. But in the modern visual   Age  Total Adults  Male   Female
                           environment, intermediate vision tasks have
                           a new prominence. Today, about two-thirds   16-19  26%       25%         27%
                           of the population between 15 and 64 years   20-24  62%       64%         59%
                                                                                        82%
                                                                                                    68%
                                                            25-34
                                                                              75%
                           of age use a computer at home, and more   35-44    77%       85%         70%
                           than half of employed people use a computer   45-54  75%     81%         70%
                           at work. A CIBA VISION study indicates that   55-64  61%     66%         56%
                           the average soft-lens wearer is in front of   65 and older  17%  22%     14%
                           a computer screen 29 hours a week. Many   Total              58%               64%           53%
                           ECPs remain locked in a near- or far-vision
                           paradigm and give little consideration to    Source: U.S. Bureau of Labor Statistics 2012
                           intermediate-vision tasks.

                           While it’s impossible to generalize about
                           the  proportions of patients in  individual   Occupations of U.S. Labor Force: 2012
                           practices who have different occupations,                              Million  % of Total
                           across the country, most employed people
                           work  indoors  in  jobs  involving  mostly  near-   Business management/education/healthcare  75.2  53%
                           and intermediate-vision tasks. Half of U.S.   Office/administrative support  17.7
                           workers are engaged in business, education   Managers/business/operations/  26.5
                                                                computer/professionals
                           or healthcare jobs, nearly all of which involve   Healthcare practitioners and support  11.5
                           computer work, paperwork or both. The other   Teachers                   8.5
                           half of the workforce is employed in a variety   Other                  11.0
                           of settings with varied vision demands.  At   Service workers           37.4      26%
                           least 10 percent of the workforce spends   Sales                        15.5
                           much of the workday outside in construction,   Food preparation          8.0
                           transportation, landscaping, maintenance or   Cleaning/maintenance       5.6
                           agricultural jobs. Another 10 percent of the   Personal service          5.3
                           workforce operates a vehicle much of the day   Public safety             3.1
                           or is  in a car  traveling  between work sites   Construction/productions/installation/repair  20.3  14%
                           or customers. At least 15 percent of adult   Manufacturing/production    8.5
                           eyewear users need safety eyewear, with jobs   Construction/extraction   7.0
                           in manufacturing, construction, maintenance   Installation/maintenance/repair  4.8
                           or repair.                       Transportation                          8.5       6%
                                                            Farming/fishing                         1.0       1%
                                                            Total                                 139.9     100%
                                                            Source: U.S. Bureau of Labor Statistics, Occupational Employment and Wages 2012


     22  Best Practices of Spectacle Lens Management 2015