
Page 168 - Zakat & Waqf: Impact on Women and Community Development
P. 168
158 | Zakat & Waqf: Impact on Women and Community Development
© Zakat & Waqf: Impact on Women and Community Development
ISBN 978-967-####-##-#
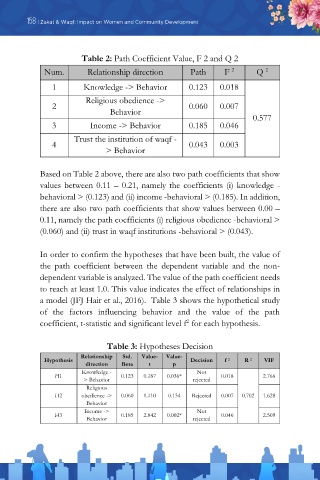
Table 2: Path Coefficient Value, F 2 and Q 2
Num. Relationship direction Path F Q
2
2
1 Knowledge -> Behavior 0.123 0.018
Religious obedience ->
2 0.060 0.007
Behavior 0.577
3 Income -> Behavior 0.185 0.046
Trust the institution of waqf -
4 0.043 0.003
> Behavior
Based on Table 2 above, there are also two path coefficients that show
values between 0.11 – 0.21, namely the coefficients (i) knowledge -
behavioral > (0.123) and (ii) income -behavioral > (0.185). In addition,
there are also two path coefficients that show values between 0.00 –
0.11, namely the path coefficients (i) religious obedience -behavioral >
(0.060) and (ii) trust in waqf institutions -behavioral > (0.043).
In order to confirm the hypotheses that have been built, the value of
the path coefficient between the dependent variable and the non-
dependent variable is analyzed. The value of the path coefficient needs
to reach at least 1.0. This value indicates the effect of relationships in
a model (JFJ Hair et al., 2016). Table 3 shows the hypothetical study
of the factors influencing behavior and the value of the path
coefficient, t-statistic and significant level f for each hypothesis.
2
Table 3: Hypotheses Decision
Relationship Std. Value- Value-
Hypothesis Decision f 2 R 2 VIF
direction Beta t p
Knowledge - Not
H1 0.123 0.187 0.036* 0.018 2.766
> Behavior rejected
Religious
H2 obedience -> 0.060 1.110 0.134 Rejected 0.007 0.702 1.628
Behavior
Income -> Not
H3 0.185 2.842 0.002* 0.046 2.509
Behavior rejected
154