Page 4 - POWERGEN E-Brochure
P. 4

VERIFY SAVINGS IN ELECTRIC BILLS                                                                        NORMALIZING ELECTRIC BILLS
                                                                                                        POWERGEN uses Metrix 4 to normalize energy impacting variables and
METRIX 4 UTILITY ACCOUNTING SOFTWARE                                                                    verify true cost savings of installed XL Systems. Metrix 4 normalizes
POWERGEN uses Metrix 4 utility accounting software, a statistical based                                 variables and relates them together using regression analysis and other
accounting application that uses regressions analysis to calculate energy                               statistical methods.
savings in customer electric bills attributable to an installed XL Energy
Conservation System (XL System).                                                                        Typical variables to be normalized when comparing historical electric
                                                                                                        bills to performance period electric bills include:
Metrix 4 is widely accepted and used by energy managers, facility manag-
ers, property managers and energy consultants who track kW demand,                                                  # of Days in Bill Period                      Downtime
kWh consumption and determine energy savings for Energy Conservation
Measures (ECM) like the XL System.                                                                                  Electric Rates & Tari?s                       Occupancy

METRIX 4 ANSWERS TOUGH QUESTIONS                                                                                    Production Volume                             Weather
Obtaining funding for an energy project can be di?cult. So it’s important
to accurately justify the expenditure up-front and to verify the electricity                            Other variables could include facility size (sqft) due to facility expansion
savings following installation.                                                                         or shrinkage, facility load (Amps) due to equipment adds, deducts and
                                                                                                        upgrades and installation of other ECMs during the performance period
Imagine if performance period utility bills showed increased usage kWh                                  such as lighting upgrades, load shedding, etc.
and cost, even though the customer saved energy. Metrix 4 can answer
di?cult questions like this and more when verifying energy savings.                                     METRIX 4 ACCOUNTING METHOD
                                                                                                        Metrix 4 uses “Cost Avoidance” accounting to determine the true cost
     Is our energy savings program really saving the amount of money                                    savings in electric bills. In other words, how much electricity would
     we expected?                                                                                       your facility have used in the 2015 Baseline Year” when normalized to
     How did weather, occupancy or production volume impact energy                                      2016 “Performance Year” conditions?
     savings this year? Did we achieve our energy savings goal?

     Should we keep our current electricity rate plan or should we switch
     to the new provider’s proposed rate plan?
     How much will adding a 3rd shift cost in terms of energy cost? Will
     this non-peak 3rd shift help our load factor or hurt it?

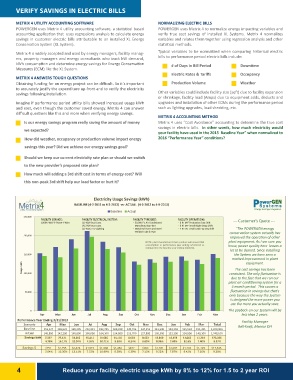
                                                             Electricity Usage Savings (kWh)                                                                             PowerGEN
                                                                                                                                                                                       Systems
                                                BASELINE (4-2-2011 to 4-2-2012) -vs- ACTUAL (4-3-2012 to 4-9-2013)
                                                                                                                                                                                                         Energy Savings Integrators
                                                                                Baseline Actual
                                                                                                                                                                     --- Customer’s Quote ---
           250,000   FACILITY SERVICE:                   FACILITY ELECTRICAL SYSTEM:  FACILITY TYPE/SIZE:                    FACILITY OPERATIONS:
           200,000   2000A 480V 3-Phase 4-Wire           (2) 480V Bus Ducts           - 50,000 Ft. Air Conditioned           - 8 Hr M-F Production Day Shift           “The POWERGEN energy
           150,000                                       (4) 240V Bus Ducts                                                  - 8 Hr M-F Small Night Setup Shift   conservation system actually has
                                                         (1) 480/277V Lighting          Manufacturing Plant                  - 4 Hr SAT Small Catch-up Day Shift   improved the operation of other
                                                                                      - Metal Roll Form and Steel                                                 plant equipment. As I am sure you
                                                                                                                                                                  know, power quality here leaves a
                                                                                        Welded Tube & Pipe                                                         lot to be desired. Since installing

                                                                                               NOTE: plant manufactured more product with lower kWh                   the System we have seen a
                                                                                               consumption in performance year ending 3/31/2013 as                  marked improvement in plant
                                                                                               compared to the baseline year ending 4/2/2012.
                                                                                                                                                                                equipment.
Usage kWh  100,000
                                                                                                                                                                       The cost savings has been
           50,000                                                                                                                                                 consistent. The only ?uctuation is
                                                                                                                                                                    due to the fact that we run our
           0                     May            Jun        Jul       Aug              Sep Oct Nov Dec                        Jan       Feb             Mar        plant air conditioning system for a
                     Apr
                                                  Jun       Jul     Aug                                                        Feb      Mar            Total        4 month period. This causes a
Performance Year Ending 3/31/2013               190,205  212,411  183,785                                                    135,563  151,301        1,920,406     ?uctuation in savings but that’s
                                                165,600  196,800  164,100                                                    124,500  140,100        1,748,100    only because the way the System
           Scenario       Apr May               24,605   15,611   19,685     Sep        Oct      Nov      Dec         Jan     11,063  11,201          172,306      is designed the more power you
                                                12.94%    7.35%   10.71%   168,918    130,723  137,253  143,340     144,159    8.16%   7.40%                       use the more you actually save.
           Baseline  153,127 169,621                                       154,800    122,700  127,800  130,500     133,200                            8.97%
                                                         $1,515   $1,938   14,118      8,023    9,453   12,840      10,959   $1,103   $1,129                      The payback on our System will be
                                                          7.52%   10.89%    8.36%      6.14%    6.89%    8.96%       7.60%    8.42%    7.66%         $17,345                less than 2 years.
                                                                                                                                                       9.20%
                                                                                                                                                                            Facility Manager
                                                                                                                                                                         Roll-Kraft, Mentor OH

           Actual    145,800 142,200

           Savings kWh 7,327 27,421
                          4.78% 16.17%

Savings $                 $751   $2,755 $2,474                             $1,460     $872     $969     $1,281      $1,097
                          5.04%  16.36% 13.11%                              8.58%     6.39%    7.15%     9.22%       7.87%

4 Reduce your facility electric usage kWh by 8% to 12% for 1.5 to 2 year ROI
   1   2   3   4   5   6   7   8