
Page 6 - POWERGEN E-Brochure
P. 6
TIS PERFORMANCE TESTING
POWERGEN measures real-time performance of XL Systems using Timed Since most commercial and industrial electricity consumers are billed for
Interval Sampling (TIS) testing. The 6 performance graphs below is an kWh consumption hours, highest 30 minute peak kW demand, kVAR
actual case study of a 500HP Motor using the TIS testing method. reactive demand and power quality. POWERGEN can extrapolate a
POWERGEN uses NIST certi?ed & calibrated data logging meters, power customer’s energy savings using TIS test results to determine how an XL
quality meters and Timed Interval Sampling (TIS) testing techniques. System is performing against the proposed energy savings and ROI payback
This analytical performance testing method conforms to the Interna- period.
tional Performance Monitoring and Veri?cation Protocols (IPMVP) set POWERGEN relies on TIS performance test to con?rm an XL System ...
forth by the U. S. Department of Energy as the best mechanism to
evaluate performance of Energy Conservation Measures (ECMs). is performing to XL product speci?cations,
TIS performance testing of XL Systems is conducted for approx 1.5 hours was installed in an optimized manner and
when a facility is operating under normal load conditions. During this will achieve or exceed the proposed energy savings and ROI
time, the XL System is systematically turned ON and OFF in 5 minute pay back period.
intervals while the six electrical measurements below and other power
quality measurements are recorded every second. GRAPH DENOTATIONS
XL ON XL System Switched ON for 5 minutes.
XL OFF XL System Switched OFF for 5 minutes.
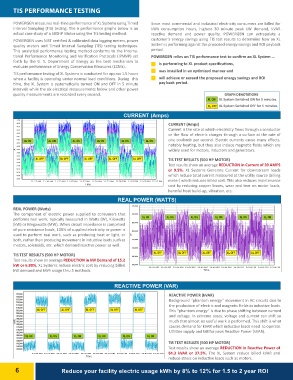
GRAPH #2 - CURRENT (A) CURRENT (Amps)
RECORDING @ 500 HP DC MOTOR FOR TIS TEST OF (3) XL UNITS @ 500HP DC MOTOR
1/10/2014 11:20:02 AM - 1/10/2014 12:15:02 PM
4 4 0440 XULSEOS ONN XULSEOS ONN XLUSEOS NON XULSEOS ONN XULSEOS ONN CURRENT (Amps)
4 3 5435 Current is the rate at which electricity ?ows through a conductor
4 3 0430VAR A or the ?ow of electric charges through a surface at the rate of
4 2 5425 VAR XLUSEOSONN one coulomb per second. Electric currents cause many e?ects,
4 2 0420 A notably heating, but they also induce magnetic ?elds which are
4 1 5415 W widely used for motors, inductors and generators.
4 1 0410 W
4 0 5405
4 0 0400
3 9 5395
3 9 0390
3 8 5385 XULSEOS OFFFF XULSEOS OFFFF XULSEOS OFFFF XULSEOS OFFFF XLUSEOS OFFFF TIS TEST RESULTS (500 HP MOTOR)
3 8 0380
3 7 5375 Test results show an average REDUCTION in Current of 39 AMPS
3 7 0370
365365 or 9.5%. XL Systems Generate Current for downstream loads
3 6 0360 which reduce total current measured at the utility source (billing
3 5 5355
3 5 0350 meter) which reduces billed cost. This also reduces maintenance
cost by reducing copper losses, wear and tear on motor loads,
111:125::020 5AMAM 111:130::030 0AMAM 111:135::030 5AMAM 111:140::040 0AMAM 111:145::040 5AMAM 1111:50::0500AMAM 1111:55::5005AMAM 1122:0:00:000PMPM 1122:05::0005PMPM 1122:10::0000PMPM 1122:1:51:005PMPM
TimeTime
?????? RMS Current Ø1 (369.86 A, min:355.87 A; max:441.66 A; avg:397.33 A) ?????? RMS Current Ø2 (364.88 A, min:350.61 A; max:432.24 A; avg:390.45 A) ?????? RMS Current Ø3 (359.01 A, min:349.74 A; max:431.15 A; avg:387.15 A)
harmful heat build-up, vibration, etc.
REAL POWER (WATTS) GRAPH #3 - REAL POWER (WATTS)
RECORDING @ 500 HP DC MOTOR FOR TIS TEST OF (3) XL UNITS @ 500HP DC MOTOR
1/10/2014 11:20:02 AM - 1/10/2014 12:15:02 PM
REAL POWER (Watts) 2 3 5 ,20305,0000 XULSESOONN XULSESOONN XLUSEOS NON XULSEOS ONN XULSEOS ONN XULSESOONN
The component of electric power supplied to consumers that 234,000
performs real work, typically measured in Watts (W), Kilowatts 233,000 XULSEOS OFFFF XULSESOOFFFF XULSEOS OFFFF XULSESOOFFFF XULSEOS OFFFF
(kW) or Megawatts (MW). When circuit impedance is comprised 232,000
of pure resistance loads, 100% of supplied electricity or power is 231,000
used to perform real work, such as producing heat or light, or
both, rather than producing movement in inductive loads such as 2 3 0 ,20300,0000
motors, solenoids, etc. which demand reactive power as well. 229,000
TIS TEST RESULTS (500 HP MOTOR) 228,000
Test results show an average REDUCTION in kW Demand of 15.2 227,000
kW or 6.80%. XL Systems reduce electric cost by reducing billed 226,000
kW demand and kWh usage thru 5 methods.
2 2 5 ,20205,0000
224,000
223,000
222,000
2 2 0 ,20201,0000
220,000
219,000
218,000
217,000
2 1 5 ,20106,0000
215,000
214,000
213,000
212,000
2 1 0 ,20101,0000
210,000
209,000
208,000
207,000
2 0 5 ,20006,0000
205,000
204,000
203,000
2 0 0 ,20002,0000
111:125::020 5AMAM 1111:30::030 0A MAM 111:135::030 5AMAM 111:140::0400AMAM 111:145::040 5AMAM 1111:50::5000AMAM 1111:5:55:005AMAM 1122:0:00:000PMPM 1122:0:5:0005PMPM 1122:10::0000PMPM 1122:1:51:005PMPM
TimeTime
?????? Real Pow er Total (225891.69 W, min:201328.80 W; max:235050.59 W; avg:217329.56 W)
GRAPH #4 - REACTIVE POWER (VAR)
REACTIVE POWER (VAR)RECORDING @ 500 HP DC MOTOR FOR TIS TEST OF (3) XL UNITS @ 500HP DC MOTOR
1/10/2014 11:20:02 AM - 1/10/2014 12:15:02 PM
2 3 523,05,00000 XULSESOOFFFF XULSEOS OFFFF XULSEOS OFFFF XULSEOS OFFFF XULSEOS OFFFF REACTIVE POWER (kVAR)
2 3 023,00,00000 Background “phantom energy” movement in AC circuits due to
2 2 522,05,00000 XULSESOONN XULSEOS ONN XULSEOS ONN XULSEOS ONN XULSESOONN XULSEOS ONN the production of electric and magnetic ?elds in inductive loads.
2 2 022,00,00000 This “phantom energy” is due to phase shifting between current
2 1 521,05,00000 and voltage. In extreme cases, voltage and current can shift so
2 1 021,00,00000 much that almost no useful work is performed. This shift is what
2 0 520,05,00000 causes demand for kVAR which inductive loads need to operate.
2 0 020,00,00000 Utilities supply and bill for peak Reactive Power (kVAR).
1 9 519,05,00000 TIS TEST RESULTS (500 HP MOTOR)
1 9 019,00,00000 Test results show an average REDUCTION in Reactive Power of
1 8 518,05,00000 84.3 kVAR or 37.5%. The XL System reduce billed kVAR and
1 8 018,00,00000 reduce stress on inductive loads such as motors.
1 7 517,05,00000
1 7 017,00,00000
1 6 516,05,00000
1 6 016,00,00000
1 5 515,05,00000
1 5 015,00,00000
1 4 514,05,00000
1 4 014,00,00000
1 3 513,05,00000
111:125::020 5AMAM 1111:30::0300AMAM 111:135::030 5AMAM 1111:40::0400AMAM 1111:45::0405AMAM 1111:50::5000AMAM 1111:5:55:005AMAM 1122:0:00:000PMPM 1122:0:50:005PMPM 1122:10::0000PMPM 1122:1:51:005PMPM
TimeTime
?????? Reactive Pow er Total (151014.36 VAR, min:130087.61 VAR; max:239481.92 VAR; avg:179176.94 VAR)
66 Reduce your facility electric usage kWh by 8% to 12% for 1.5 to 2 year ROI