


Page 512 - JoFA_2022
P. 512
opened by Power BI, where data transformation   data after it has been imported into the Power
          and formatting occur. See the screenshot “Export-  BI desktop application. The third icon on the left
          ing Report to Excel.”                     is the Relationships View, which shows tables
            In Step 3, open the Power BI Desktop, select   and columns, allowing the user to view and create
          Get Data from the Ribbon (indicated by the top   relationships in the current model.
          red arrow in the screenshot “Opening Power BI   With the Report View highlighted, click Get
          Desktop”), and open the “Transaction Detail by Ac-  Data and select Excel from the options shown in
          count” Excel file exported from QuickBooks.   the “Opening Power BI Desktop” screenshot.
            Before we continue, please note the icons for   Next, select the file name of the previously saved
          the three view modes of the Power BI Desktop on   QuickBooks exported file. Power BI establishes a
          the left gray bar (as shown in the “Opening Power   connection with the exported file containing the
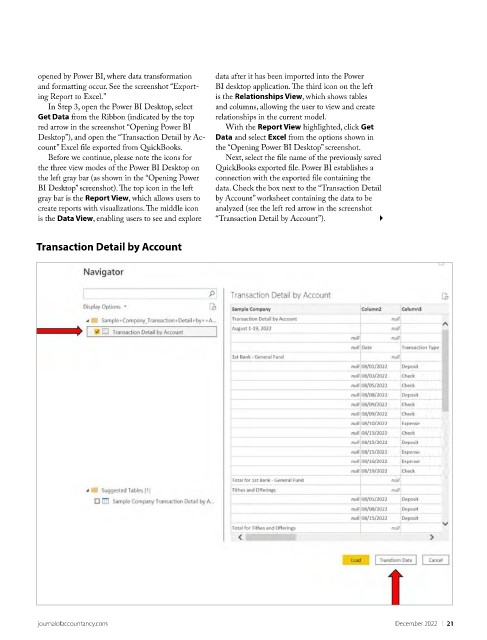
          BI Desktop” screenshot). The top icon in the left   data. Check the box next to the “Transaction Detail
          gray bar is the Report View, which allows users to   by Account” worksheet containing the data to be
          create reports with visualizations. The middle icon   analyzed (see the left red arrow in the screenshot
          is the Data View, enabling users to see and explore   “Transaction Detail by Account”).

          Transaction Detail by Account


          journalofaccountancy.com                                                             December 2022    |   21

