


Page 510 - JoFA_2022
P. 510
lthough accounting information systems of-  and load data into Power BI. The second method,
               fer vast value to accountants and their clients,   which we call the QuickBooks interface ap-  About the
          Athey often lack the data analytical capabilities   proach, is more complicated and uses the custom   authors
          desired for creating additional value. QuickBooks,   interface in Power BI to retrieve data directly from   William Stewart
          for example, provides basic analytical support   QuickBooks. Either method can be used to create   Thomas, CPA,
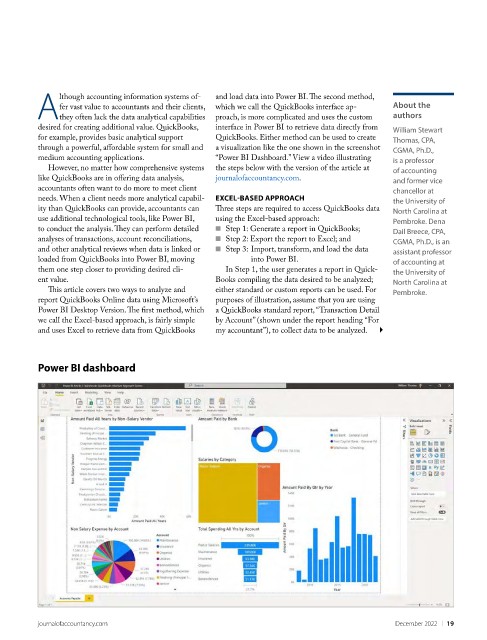
          through a powerful, affordable system for small and   a visualization like the one shown in the screenshot   CGMA, Ph.D.,
          medium accounting applications.           “Power BI Dashboard.” View a video illustrating   is a professor
            However, no matter how comprehensive systems   the steps below with the version of the article at   of accounting
          like QuickBooks are in offering data analysis,   journalofaccountancy.com.          and former vice
          accountants often want to do more to meet client                                    chancellor at
          needs. When a client needs more analytical capabil-  EXCEL-BASED APPROACH           the University of
          ity than QuickBooks can provide, accountants can   Three steps are required to access QuickBooks data   North Carolina at
          use additional technological tools, like Power BI,   using the Excel-based approach:   Pembroke. Dena
          to conduct the analysis. They can perform detailed   ■    Step 1: Generate a report in QuickBooks;   Dail Breece, CPA,
          analyses of transactions, account reconciliations,   ■    Step 2: Export the report to Excel; and  CGMA, Ph.D., is an
          and other analytical reviews when data is linked or   ■    Step 3: Import, transform, and load the data    assistant professor
          loaded from QuickBooks into Power BI, moving      into Power BI.                    of accounting at
          them one step closer to providing desired cli-  In Step 1, the user generates a report in Quick-  the University of
          ent value.                                Books compiling the data desired to be analyzed;   North Carolina at
            This article covers two ways to analyze and   either standard or custom reports can be used. For   Pembroke.
          report QuickBooks Online data using Microsoft’s   purposes of illustration, assume that you are using
          Power BI Desktop Version. The first method, which   a QuickBooks standard report, “Transaction Detail
          we call the Excel-based approach, is fairly simple   by Account” (shown under the report heading “For
          and uses Excel to retrieve data from QuickBooks   my accountant”), to collect data to be analyzed.


          Power BI dashboard


          journalofaccountancy.com                                                             December 2022    |   19

