Page 433 - ACFE Fraud Reports 2009_2020
P. 433
Schemes by Industry
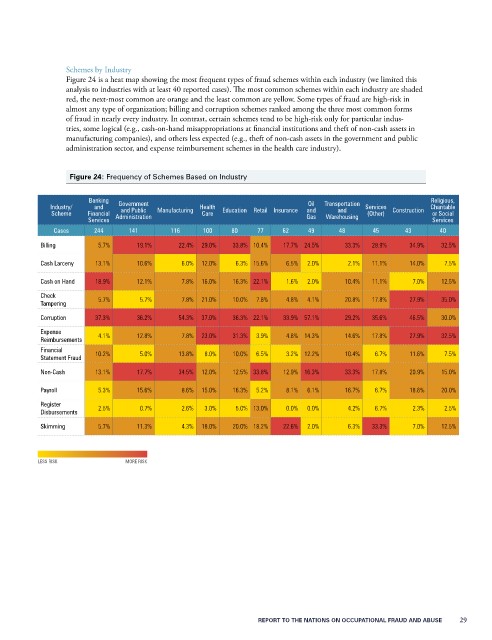
                 Figure 24 is a heat map showing the most frequent types of fraud schemes within each industry (we limited this
                 analysis to industries with at least 40 reported cases). The most common schemes within each industry are shaded
                 red, the next-most common are orange and the least common are yellow. Some types of fraud are high-risk in
                 almost any type of organization; billing and corruption schemes ranked among the three most common forms
                 of fraud in nearly every industry. In contrast, certain schemes tend to be high-risk only for particular indus-
                 tries, some logical (e.g., cash-on-hand misappropriations at financial institutions and theft of non-cash assets in
                 manufacturing companies), and others less expected (e.g., theft of non-cash assets in the government and public
                 administration sector, and expense reimbursement schemes in the health care industry).


                  Figure 24: Frequency of Schemes Based on Industry


                       Banking                                                                             Religious,
                                                                             Oil
             Industry/  and   Government   Manufacturing  Health   Education  Retail Insurance  and   Transportation   Services   Construction  Charitable
                                                                                    and
                               and Public
              Scheme   Financial   Administration  Care                     Gas  Warehousing  (Other)      or Social
                       Services                                                                            Services
              Cases     244      141       116     100    80    77    62     49     48      45      43       40
           Billing       5.7%      19.1%     22.4%  29.0%  33.8% 10.4%  17.7% 24.5%   33.3%  28.9%   34.9%   32.5%
           Cash Larceny  13.1%     10.6%      6.0%  12.0%  6.3% 15.6%  6.5%  2.0%     2.1%  11.1%    14.0%    7.5%
           Cash on Hand  18.9%     12.1%      7.8%  16.0%  16.3% 22.1%  1.6%  2.0%    10.4%  11.1%    7.0%   12.5%

           Check         5.7%      5.7%       7.8%  21.0%  10.0%  7.8%  4.8%  4.1%    20.8%  17.8%   27.9%   35.0%
           Tampering
           Corruption   37.3%      36.2%     54.3%  37.0%  36.3% 22.1%  33.9% 57.1%   29.2%  35.6%   46.5%   30.0%
           Expense       4.1%      12.8%      7.8%  23.0%  31.3%  3.9%  4.8% 14.3%    14.6%  17.8%   27.9%   32.5%
           Reimbursements
           Financial    10.2%      5.0%      13.8%  8.0%  10.0%  6.5%  3.2% 12.2%     10.4%  6.7%    11.6%    7.5%
           Statement Fraud
           Non-Cash     13.1%      17.7%     34.5%  12.0%  12.5% 33.8%  12.9% 16.3%   33.3%  17.8%   20.9%   15.0%

           Payroll       5.3%      15.6%      8.6%  15.0%  16.3%  5.2%  8.1%  6.1%    16.7%  6.7%    18.6%   20.0%
           Register      2.5%      0.7%       2.6%  3.0%   5.0% 13.0%  0.0%  0.0%     4.2%   6.7%     2.3%    2.5%
           Disbursements

           Skimming      5.7%      11.3%      4.3%  18.0%  20.0% 18.2%  22.6%  2.0%   6.3%  33.3%     7.0%   12.5%


          LESS RISk                                                          MORE RISk


                                                                REPORT TO THE NATIONS ON OCCUPATIONAL FRAUD AND ABUSE           29

