Page 438 - ACFE Fraud Reports 2009_2020
P. 438
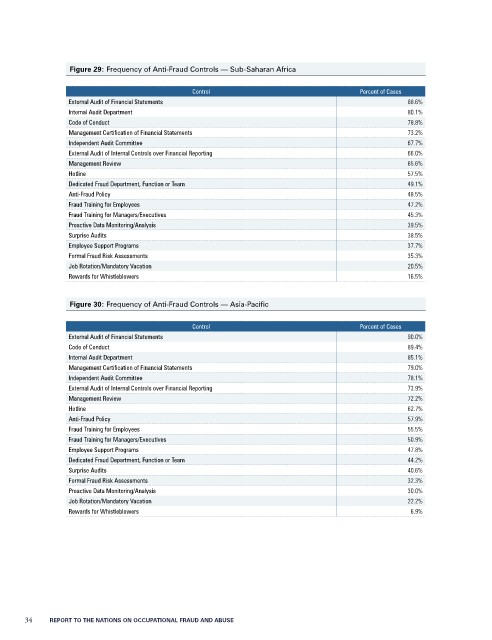
Figure 29: Frequency of Anti-Fraud Controls — Sub-Saharan Africa

                                                Control                                  Percent of Cases
                  External Audit of Financial Statements                                             88.6%
                  Internal Audit Department                                                          80.1%
                  Code of Conduct                                                                    78.8%
                  Management Certification of Financial Statements                                   73.2%
                  Independent Audit Committee                                                        67.7%
                  External Audit of Internal Controls over Financial Reporting                       66.0%
                  Management Review                                                                  65.6%
                  Hotline                                                                            57.5%
                  Dedicated Fraud Department, Function or Team                                       49.1%
                  Anti-Fraud Policy                                                                  48.5%
                  Fraud Training for Employees                                                       47.2%
                  Fraud Training for Managers/Executives                                             45.3%
                  Proactive Data Monitoring/Analysis                                                 39.5%
                  Surprise Audits                                                                    38.5%
                  Employee Support Programs                                                          37.7%
                  Formal Fraud Risk Assessments                                                      35.3%
                  Job Rotation/Mandatory Vacation                                                    20.5%
                  Rewards for Whistleblowers                                                         16.5%


                  Figure 30: Frequency of Anti-Fraud Controls — Asia-Pacific

                                                Control                                  Percent of Cases
                  External Audit of Financial Statements                                             90.0%
                  Code of Conduct                                                                    89.4%
                  Internal Audit Department                                                          85.1%
                  Management Certification of Financial Statements                                   79.0%
                  Independent Audit Committee                                                        78.1%
                  External Audit of Internal Controls over Financial Reporting                       73.9%
                  Management Review                                                                  72.2%
                  Hotline                                                                            62.7%
                  Anti-Fraud Policy                                                                  57.9%
                  Fraud Training for Employees                                                       55.5%
                  Fraud Training for Managers/Executives                                             50.9%
                  Employee Support Programs                                                          47.8%
                  Dedicated Fraud Department, Function or Team                                       44.2%
                  Surprise Audits                                                                    40.6%
                  Formal Fraud Risk Assessments                                                      32.3%
                  Proactive Data Monitoring/Analysis                                                 30.0%
                  Job Rotation/Mandatory Vacation                                                    22.2%
                  Rewards for Whistleblowers                                                          6.9%


       34           REPORT TO THE NATIONS ON OCCUPATIONAL FRAUD AND ABUSE

