Page 439 - ACFE Fraud Reports 2009_2020
P. 439
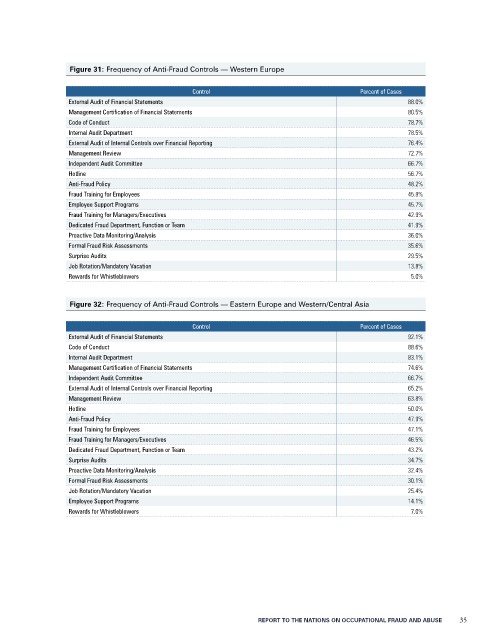
Figure 31: Frequency of Anti-Fraud Controls — Western Europe

                                                Control                                  Percent of Cases
                  External Audit of Financial Statements                                             88.0%
                  Management Certification of Financial Statements                                   80.5%
                  Code of Conduct                                                                    78.7%
                  Internal Audit Department                                                          78.5%
                  External Audit of Internal Controls over Financial Reporting                       76.4%
                  Management Review                                                                  72.7%
                  Independent Audit Committee                                                        66.7%
                  Hotline                                                                            56.7%
                  Anti-Fraud Policy                                                                  48.2%
                  Fraud Training for Employees                                                       45.8%
                  Employee Support Programs                                                          45.7%
                  Fraud Training for Managers/Executives                                             42.9%
                  Dedicated Fraud Department, Function or Team                                       41.9%
                  Proactive Data Monitoring/Analysis                                                 36.0%
                  Formal Fraud Risk Assessments                                                      35.6%
                  Surprise Audits                                                                    29.5%
                  Job Rotation/Mandatory Vacation                                                    13.8%
                  Rewards for Whistleblowers                                                          5.0%


                  Figure 32: Frequency of Anti-Fraud Controls — Eastern Europe and Western/Central Asia

                                                Control                                  Percent of Cases
                  External Audit of Financial Statements                                             92.1%
                  Code of Conduct                                                                    88.6%
                  Internal Audit Department                                                          83.1%
                  Management Certification of Financial Statements                                   74.6%
                  Independent Audit Committee                                                        66.7%
                  External Audit of Internal Controls over Financial Reporting                       65.2%
                  Management Review                                                                  63.8%
                  Hotline                                                                            50.0%
                  Anti-Fraud Policy                                                                  47.9%
                  Fraud Training for Employees                                                       47.1%
                  Fraud Training for Managers/Executives                                             46.5%
                  Dedicated Fraud Department, Function or Team                                       43.2%
                  Surprise Audits                                                                    34.7%
                  Proactive Data Monitoring/Analysis                                                 32.4%
                  Formal Fraud Risk Assessments                                                      30.1%
                  Job Rotation/Mandatory Vacation                                                    25.4%
                  Employee Support Programs                                                          14.1%
                  Rewards for Whistleblowers                                                          7.0%


                                                                REPORT TO THE NATIONS ON OCCUPATIONAL FRAUD AND ABUSE           35

