Page 498 - ACFE Fraud Reports 2009_2020
P. 498
How Occupational Fraud Is Committed


                 Asset Misappropriation Sub-Schemes
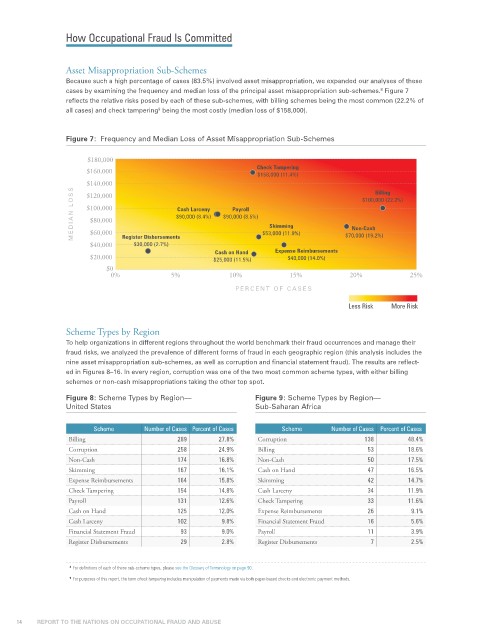
                 Because such a high percentage of cases (83.5%) involved asset misappropriation, we expanded our analyses of these
                 cases by examining the frequency and median loss of the principal asset misappropriation sub-schemes.  Figure 7
                                                                                              8
                 reflects the relative risks posed by each of these sub-schemes, with billing schemes being the most common (22.2% of
                 all cases) and check tampering  being the most costly (median loss of $158,000).
                                        9

                 Figure 7:  Frequency and Median Loss of Asset Misappropriation Sub-Schemes


                      $180,000
                      $160,000                                  Check Tampering
                                                                $158,000 (11.4%)
                      $140,000                                                               Billing
                   MEDIAN L OSS  $100,000   $90,000 (8.4%)  $90,000 (8.5%)  Skimming   Non-Cash
                      $120,000
                                                                                          $100,000 (22.2%)
                                                          Payroll
                                            Cash Larceny
                       $80,000
                       $60,000
                       $40,000  Register Disbursements           $53,000 (11.9%)      $70,000 (19.2%)
                                  $30,000 (2.7%)
                                                      Cash on Hand   Expense Reimbursements
                       $20,000                       $25,000 (11.5%)    $40,000 (14.0%)
                           $0
                            0%             5%            10%            15%            20%           25%
                                                           PERCENT OF CASES
                                                                                      Less Risk  More Risk


                 Scheme Types by Region
                 To help organizations in different regions throughout the world benchmark their fraud occurrences and manage their
                 fraud risks, we analyzed the prevalence of different forms of fraud in each geographic region (this analysis includes the
                 nine asset misappropriation sub-schemes, as well as corruption and financial statement fraud). The results are reflect-
                 ed in Figures 8–16. In every region, corruption was one of the two most common scheme types, with either billing
                 schemes or non-cash misappropriations taking the other top spot.
                 Figure 8: Scheme Types by Region—              Figure 9: Scheme Types by Region—
                 United States                                  Sub-Saharan Africa

                        Scheme      Number of Cases Percent of Cases  Scheme      Number of Cases Percent of Cases
                  Billing                    289       27.8%    Corruption                138        48.4%
                  Corruption                 258       24.9%    Billing                    53        18.6%
                  Non-Cash                   174       16.8%    Non-Cash                   50        17.5%
                  Skimming                   167       16.1%    Cash on Hand               47        16.5%
                  Expense Reimbursements     164       15.8%    Skimming                   42        14.7%
                  Check Tampering            154       14.8%    Cash Larceny               34        11.9%
                  Payroll                    131       12.6%    Check Tampering            33        11.6%
                  Cash on Hand               125       12.0%    Expense Reimbursements     26         9.1%
                  Cash Larceny               102       9.8%     Financial Statement Fraud  16         5.6%
                  Financial Statement Fraud  93        9.0%     Payroll                    11         3.9%
                  Register Disbursements     29        2.8%     Register Disbursements      7         2.5%


                  8   For definitions of each of these sub-scheme types, please see the Glossary of Terminology on page 90.
                  9   For purposes of this report, the term check tampering includes manipulation of payments made via both paper-based checks and electronic payment methods.


     14           REPORT TO THE NATIONS ON OCCUPATIONAL FRAUD AND ABUSE

