Page 500 - ACFE Fraud Reports 2009_2020
P. 500
How Occupational Fraud Is Committed


                 Figure 16: Scheme Types by Region—
                 Middle East and North Africa
                                                                  IN EVERY REGION,

                        Scheme      Number of Cases Percent of Cases  CORRUPTION WAS
                  Corruption                 45        57.0%
                  Non-Cash                   21        26.6%      ONE OF THE TWO
                  Cash on Hand               15        19.0%      MOST COMMON
                  Billing                    12        15.2%
                  Expense Reimbursements      9        11.4%      SCHEME TYPES.
                  Skimming                    9        11.4%
                  Check Tampering             6        7.6%
                  Financial Statement Fraud   5        6.3%
                  Cash Larceny                4        5.1%
                  Payroll                     2        2.5%
                  Register Disbursements      1        1.3%


                 Corruption Cases by Region
                 Corruption is a global problem. It is not limited to any particular region, and it affects organizations of all sizes, types,
                 and industries, regardless of whether their operations cross jurisdictional lines. Nonetheless, there are certain places in
                 the world where corruption is a greater risk than in others. We analyzed the corruption cases reported to us by region to
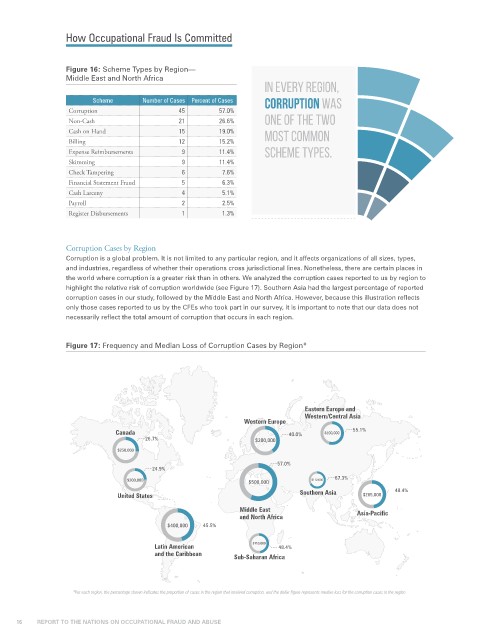
                 highlight the relative risk of corruption worldwide (see Figure 17). Southern Asia had the largest percentage of reported
                 corruption cases in our study, followed by the Middle East and North Africa. However, because this illustration reflects
                 only those cases reported to us by the CFEs who took part in our survey, it is important to note that our data does not
                 necessarily reflect the total amount of corruption that occurs in each region.


                 Figure 17: Frequency and Median Loss of Corruption Cases by Region*


                                                                            Eastern Europe and
                                                                            Western/Central Asia
                                                             Western Europe
                             Canada                                     40.0%    $200,000  55.1%
                                     26.7%                      $300,000
                              $250,000
                                                                     57.0%
                                      24.9%
                                $200,000                      $500,000       $112,000  67.3%
                                                                          Southern Asia           48.4%
                              United States                                               $285,000
                                                            Middle East
                                                            and North Africa             Asia-Pacific
                                          $400,000  45.5%

                                       Latin American          $150,000  48.4%
                                       and the Caribbean  Sub-Saharan Africa


                   *For each region, the percentage shown indicates the proportion of cases in the region that involved corruption, and the dollar figure represents median loss for the corruption cases in the region.


     16           REPORT TO THE NATIONS ON OCCUPATIONAL FRAUD AND ABUSE

