
Page 686 - ACFE Fraud Reports 2009_2020
P. 686
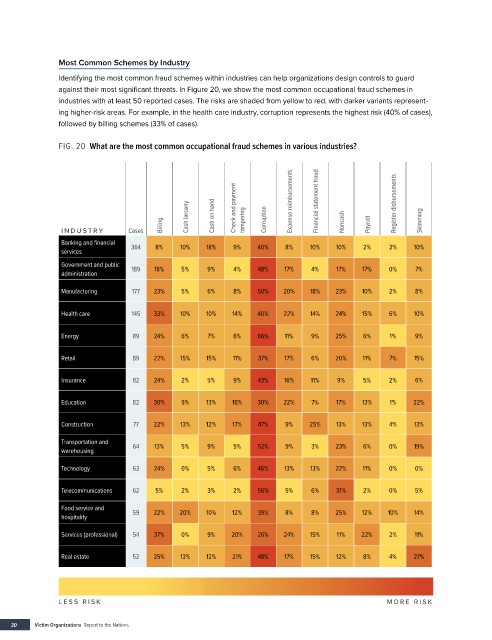
Most Common Schemes by Industry
               Identifying the most common fraud schemes within industries can help organizations design controls to guard
               against their most significant threats. In Figure 20, we show the most common occupational fraud schemes in
               industries with at least 50 reported cases. The risks are shaded from yellow to red, with darker variants represent-
               ing higher-risk areas. For example, in the health care industry, corruption represents the highest risk (40% of cases),
               followed by billing schemes (33% of cases).

               FIG. 20  What are the most common occupational fraud schemes in various industries?


                                               Cash larceny  Cash on hand  Check and payment   tampering  Corruption  Expense reimbursements  Financial statement fraud  Register disbursements  Skimming
                                         Billing                                     Noncash  Payroll
                INDUS TR Y      Cases
                Banking and financial   364  8%  10%  18%  9%   40%    8%    10%   10%    2%    2%    10%
                services
                Government and public   189  18%  5%  9%  4%    48%    17%   4%    17%    17%   0%     7%
                administration

                Manufacturing    177   23%   5%     6%    8%    50%    20%   18%   23%    10%   2%     8%

                Health care      145   33%   10%    10%   14%   40%    22%   14%   24%    15%   6%    10%


                Energy            89   24%   6%     7%    6%    66%    11%   9%    25%    6%     1%    9%

                Retail            89   22%   15%    15%   11%   37%    17%   6%    20%    11%   7%    15%

                Insurance         82   24%   2%     5%    9%    43%    16%   11%    9%    5%    2%     6%


                Education         82   30%   9%     13%   18%   30%    22%   7%    17%    13%    1%   22%

                Construction      77   22%   13%    12%   17%   47%    9%    25%   13%    13%   4%     13%

                Transportation and
                warehousing       64   13%   5%     9%    5%    52%    9%    3%    23%    6%    0%    19%

                Technology        63   24%   0%     5%    6%    46%    13%   13%   22%    11%   0%     0%

                Telecommunications  62  5%   2%     3%    2%    56%    5%    6%    31%    2%    0%     5%

                Food service and
                hospitality       59   22%   20%    10%   12%   39%    8%    8%    25%    12%   10%    14%

                Services (professional)  54  37%  0%  9%  20%   26%    24%   15%    11%   22%   2%     11%

                Real estate       52   25%   13%    12%   21%   48%    17%   15%   12%    8%    4%    27%


               LESS RISK                                                                        MORE RISK


    30    Victim Organizations  Report to the Nations