
Page 682 - ACFE Fraud Reports 2009_2020
P. 682
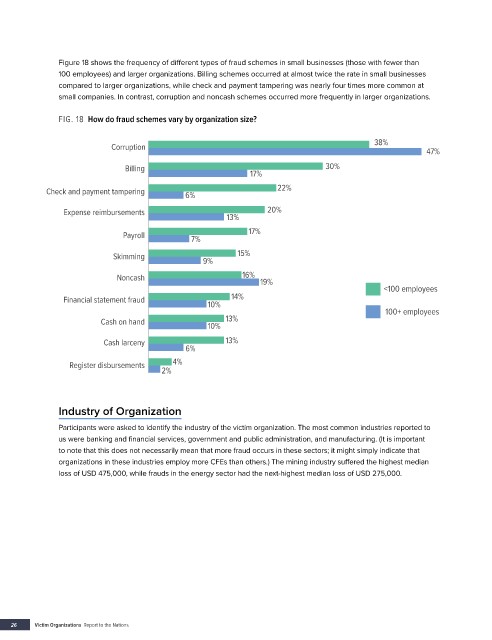
Figure 18 shows the frequency of different types of fraud schemes in small businesses (those with fewer than
               100 employees) and larger organizations. Billing schemes occurred at almost twice the rate in small businesses
               compared to larger organizations, while check and payment tampering was nearly four times more common at
               small companies. In contrast, corruption and noncash schemes occurred more frequently in larger organizations.

               FIG. 18  How do fraud schemes vary by organization size?


                            Corruption                                                       38%          47%

                                Billing                       17%                30%

            Check and payment tampering       6%                     22%


                 Expense reimbursements                            20%
                                                         13%
                               Payroll          7%            17%

                             Skimming              9%      15%


                              Noncash                       16%  19%                           <100 employees

                 Financial statement fraud                14%
                                                    10%                                        100+ employees
                          Cash on hand              10%  13%

                          Cash larceny                  13%
                                              6%

                  Register disbursements   4%
                                         2%


               Industry of Organization
               Participants were asked to identify the industry of the victim organization. The most common industries reported to
               us were banking and financial services, government and public administration, and manufacturing. (It is important
               to note that this does not necessarily mean that more fraud occurs in these sectors; it might simply indicate that
               organizations in these industries employ more CFEs than others.) The mining industry suffered the highest median
               loss of USD 475,000, while frauds in the energy sector had the next-highest median loss of USD 275,000.


    26    Victim Organizations  Report to the Nations