
Page 1095 - Small Animal Internal Medicine, 6th Edition
P. 1095
CHAPTER 59 Diagnostic Tests for Nervous System and Neuromuscular Disorders 1067
anatomic location together with MRI characteristics can be different information about tissues. The most common MR
used to predict tumor type in many cases (Figs. 59.4 and images used in veterinary neurology are T1-weighted and
VetBooks.ir 59.5). Spinal MRI has been shown to be superior to CT and T2-weighted spin-echo images. Free fluid and most fluid
within tissues (CSF, edema), appear black (low signal,
myelography in the imaging of dogs with cervical spondylo-
myelopathy, intervertebral disk herniation, synovial cysts,
T1-weighted images and white (high signal, hyperintense
lumbosacral stenosis, spinal cord neoplasia, diskospondyli- hypointense compared with normal CNS parenchyma) on
tis, and vascular events such as bleeds, infarcts, and fibrocar- compared with normal CNS parenchyma) on T2-weighted
tilaginous emboli (Fig. 59.6). In addition to identifying sites images.
of spinal cord compression, MRI allows evaluation of the Many tumors and inflammatory disorders result in
response of neural tissues to compression, helping differenti- increased fluid in tissues so have regions of increased
ate lesions causing acute clinical signs from older, more T2-weighted signal intensity (bright regions). Wispy regions
chronic lesions and scars. of high signal around lesions on T2-weighted images may
MR images are generated by the effect of transiently represent edema. (Table 59.1) T1-weighted sequences are
applied radiofrequency currents on protons that are aligned good for evaluating anatomy but are poor at detecting most
by the strong magnetic field of the MRI scanner. When lesions until MR imaging contrast material (gadolinium) is
the radiofrequency pulse is halted, the protons realign and administered. In the regions where contrast leaks into the
generate their own radiofrequency signal, which is mea- parenchyma due to a disrupted blood-brain barrier, there
sured by a coil. The combination of magnetic fields and will be increased signal intensity (brightness on T1-contrast)
radiofrequency pulses used to create an MRI image are representing the regions of the lesion that have a strong
called a pulse sequence. Different MRI sequences provide blood supply (see Fig. 59.4). In addition to the T1- and
T2-weighted images obtained using routine spin-echo
sequences, inversion recovery sequences can be used to sup-
press the high signal from fat using a short tau inversion
recovery (STIR) sequence or the signal from free fluid using
a fluid attenuated inversion recovery (FLAIR) sequence.
Suppression of the signal from free fluid with a FLAIR
sequence (making it hypointense) makes it possible to dis-
tinguish between cystic lesions and tissue edema within
brain parenchyma and also improves visualization of subtle
lesions adjacent to ventricular or subarachnoid CSF (see
Table 59.1) It is important that MR images of the brain and
spinal cord be evaluated and interpreted by specialists who
are able to distinguish artifacts from actual lesions and are
familiar with the rapidly expanding literature regarding the
MRI characteristics of neurologic lesions. More details can
be found in the recommended readings.
CEREBROSPINAL FLUID COLLECTION
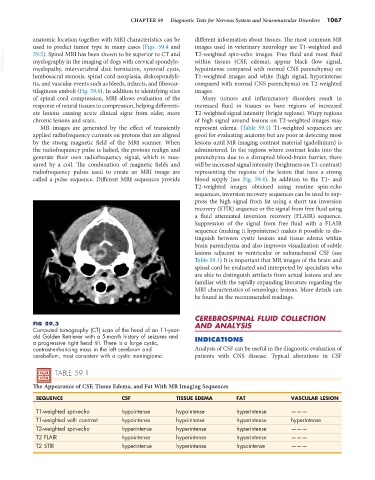
FIG 59.3 AND ANALYSIS
Computed tomography (CT) scan of the head of an 11-year-
old Golden Retriever with a 5-month history of seizures and
a progressive right head tilt. There is a large cystic, INDICATIONS
contrast-enhancing mass in the left cerebrum and Analysis of CSF can be useful in the diagnostic evaluation of
cerebellum, most consistent with a cystic meningioma. patients with CNS disease. Typical alterations in CSF
TABLE 59.1
The Appearance of CSF, Tissue Edema, and Fat With MR Imaging Sequences
SEQUENCE CSF TISSUE EDEMA FAT VASCULAR LESION
T1-weighted spin-echo hypointense hypointense hyperintense ———
T1-weighted with contrast hypointense hypointense hyperintense hyperintense
T2-weighted spin-echo hyperintense hyperintense hyperintense ———
T2 FLAIR hypointense hyperintense hyperintense ———
T2 STIR hyperintense hyperintense hypointense ———