
Page 468 - Adams and Stashak's Lameness in Horses, 7th Edition
P. 468
434 Chapter 3
A B 99.1 °F ing and help prevent serious injuries. By locating inflam
mation before clinical signs are evident, training
VetBooks.ir 95 programs can be changed to reduce stress on the
inflamed area, thereby preventing serious injury.
Long Bone Injuries
90
Thermography is of less value in the diagnosis of
most long bone problems. Since thermography evaluates
85 skin temperature, a bone needs to be in relatively close
contact with the skin to affect its temperature.
3
Consequently, bones that are heavily covered with mus
80 cle cannot be as accurately assessed by thermography.
79.1 Thermography is best utilized to evaluate dorsal meta
carpal disease or stress fractures of the radius or tibia.
Dorsal metacarpal disease, the so‐called bucked shin
98.0 °F
7
C D complex, is categorized into three grades. Grade 1 is
characterized by eliciting pain upon palpation of the
95 cannon bone, but radiographic evidence of bone pathol
ogy cannot be identified. Grade 2 is characterized by
pain over the cannon bone, but there is radiographic evi
90 dence of subperiosteal callus. Finally, grade 3 is charac
terized by cannon bone pain and radiographic evidence
of a stress or fatigue fracture. Grades 2 and 3 may be
85 indistinguishable, and radiographic confirmation of a
stress fracture may not be possible for 2–3 weeks.
Thermal variations between the latter two may help dif
80
ferentiate grade 3 lesions earlier than radiographs.
Grade 1 and 2 diseases are characterized by “hot spots”
78.0
located midshaft over the dorsal cannon bone. The “hot
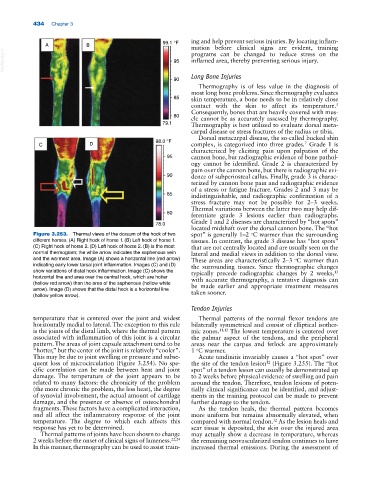
Figure 3.253. Thermal views of the dorsum of the hock of two spot” is generally 1–2 C warmer than the surrounding
o
different horses. (A) Right hock of horse 1. (B) Left hock of horse 1. tissues. In contrast, the grade 3 disease has “hot spots”
(C) Right hock of horse 2. (D) Left hock of horse 2. (B) is the most that are not centrally located and are usually seen on the
normal thermogram; the white arrow indicates the saphenous vein lateral and medial views in addition to the dorsal view.
and the warmest area. Image (A) shows a horizontal line (red arrow) These areas are characteristically 2–3 C warmer than
o
indicating early lower tarsal joint inflammation. Images (C) and (D) the surrounding tissues. Since thermographic changes
show variations of distal hock inflammation. Image (C) shows the typically precede radiographic changes by 2 weeks,
13
horizontal line and area over the central hock, which are hotter with accurate thermography, a tentative diagnosis can
(hollow red arrow) than the area of the saphenous (hollow white be made earlier and appropriate treatment measures
arrow). Image (D) shows that the distal hock is a horizontal line taken sooner.
(hollow yellow arrow).
Tendon Injuries
temperature that is centered over the joint and widest Thermal patterns of the normal flexor tendons are
horizontally medial to lateral. The exception to this rule bilaterally symmetrical and consist of elliptical isother
is the joints of the distal limb, where the thermal pattern mic zones. 11,12 The lowest temperature is centered over
associated with inflammation of this joint is a circular the palmar aspect of the tendons, and the peripheral
pattern. The areas of joint capsule attachment tend to be areas near the carpus and fetlock are approximately
“hotter,” but the center of the joint is relatively “cooler”. 1 C warmer.
o
This may be due to joint swelling or pressure and subse Acute tendinitis invariably causes a “hot spot” over
quent loss of microcirculation (Figure 3.254). No spe the site of the tendon lesion (Figure 3.255). The “hot
12
cific correlation can be made between heat and joint spot” of a tendon lesion can usually be demonstrated up
damage. The temperature of the joint appears to be to 2 weeks before physical evidence of swelling and pain
related to many factors: the chronicity of the problem around the tendon. Therefore, tendon lesions of poten
(the more chronic the problem, the less heat), the degree tially clinical significance can be identified, and adjust
of synovial involvement, the actual amount of cartilage ments in the training protocol can be made to prevent
damage, and the presence or absence of osteochondral further damage to the tendon.
fragments. These factors have a complicated interaction, As the tendon heals, the thermal pattern becomes
and all affect the inflammatory response of the joint more uniform but remains abnormally elevated, when
temperature. The degree to which each affects this compared with normal tendon. As the lesion heals and
12
response has yet to be determined. scar tissue is deposited, the skin over the injured area
Thermal patterns of joints have been shown to change may actually show a decrease in temperature, whereas
2 weeks before the onset of clinical signs of lameness. 22,24 the remaining neovascularized tendon continues to have
In this manner, thermography can be used to assist train increased thermal emissions. During the assessment of