
Page 186 - Clinical Small Animal Internal Medicine
P. 186
154 Section 3 Cardiovascular Disease
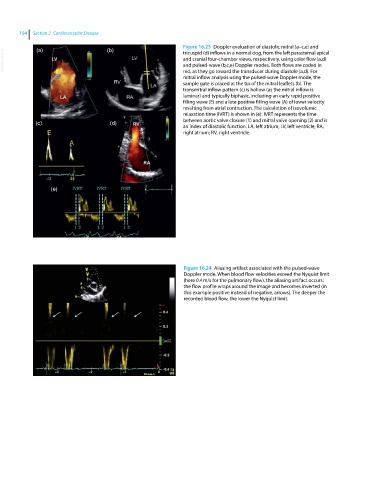
Figure 16.23 Doppler evaluation of diastolic mitral (a–c,e) and
(b)
(a)
VetBooks.ir and cranial four‐chamber views, respectively, using color flow (a,d)
tricuspid (d) inflows in a normal dog, from the left parasternal apical
and pulsed‐wave (b,c,e) Doppler modes. Both flows are coded in
red, as they go toward the transducer during diastole (a,d). For
mitral inflow analysis using the pulsed‐wave Doppler mode, the
sample gate is placed at the tip of the mitral leaflets (b). The
transmitral inflow pattern (c) is hollow (as the mitral inflow is
laminar) and typically biphasic, including an early rapid positive
filling wave (E) and a late positive filling wave (A) of lower velocity
resulting from atrial contraction. The calculation of isovolumic
relaxation time (IVRT) is shown in (e): IVRT represents the time
(c) (d) between aortic valve closure (1) and mitral valve opening (2) and is
an index of diastolic function. LA, left atrium; LV, left ventricle; RA,
right atrium; RV, right ventricle.
(e)
Figure 16.24 Aliasing artifact associated with the pulsed‐wave
Doppler mode. When blood flow velocities exceed the Nyquist limit
(here 0.4 m/s for the pulmonary flow), the aliasing artifact occurs:
the flow profile wraps around the image and becomes inverted (in
this example positive instead of negative, arrows). The deeper the
recorded blood flow, the lower the Nyquist limit.