
Page 1237 - Small Animal Clinical Nutrition 5th Edition
P. 1237
Appendices 1289
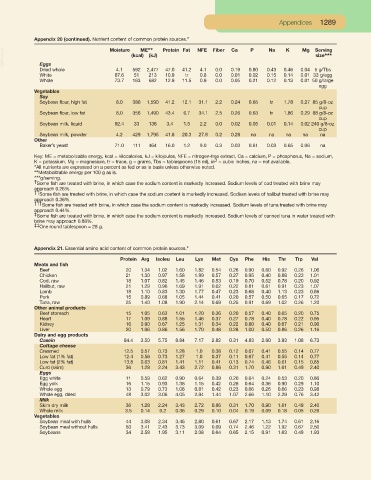
Appendix 20 (continued). Nutrient content of common protein sources.*
ME**
VetBooks.ir Moisture (kcal) (kJ) Protein Fat NFE Fiber Ca P Na K Mg Serving
size***
Eggs
Dried whole 4.1 592 2,477 47.0 41.2 4.1 0.0 0.19 0.80 0.43 0.46 0.04 5 g/Tbs
White 87.6 51 213 10.9 tr 0.8 0.0 0.01 0.02 0.15 0.14 0.01 33 g/egg
Whole 73.7 163 682 12.9 11.5 0.9 0.0 0.05 0.21 0.12 0.13 0.01 50 g/large
egg
Vegetables
Soy
Soybean flour, high fat 8.0 380 1,590 41.2 12.1 31.1 2.2 0.24 0.65 tr 1.78 0.27 85 g/8-oz
cup
Soybean flour, low fat 8.0 356 1,490 43.4 6.7 34.1 2.5 0.26 0.63 tr 1.86 0.29 88 g/8-oz
cup
Soybean milk, liquid 92.4 33 138 3.4 1.5 2.2 0.0 0.02 0.05 0.01 0.14 0.02 240 g/8-oz
cup
Soybean milk, powder 4.2 429 1,795 41.8 20.3 27.8 0.2 0.28 na na na na na
Other
Baker’s yeast 71.0 111 464 16.0 1.2 9.0 0.3 0.03 0.61 0.03 0.65 0.06 na
Key: ME = metabolizable energy, kcal = kilocalories, kJ = kilojoules, NFE = nitrogen-free extract, Ca = calcium, P = phosphorus, Na = sodium,
3
K = potassium, Mg = magnesium, tr = trace, g = grams, Tbs = tablespoons (15 ml), in = cubic inches, na = not available.
*All nutrients are expressed on a percent as fed or as is basis unless otherwise noted.
**Metabolizable energy per 100 g as is.
***g/serving.
† Some fish are treated with brine, in which case the sodium content is markedly increased. Sodium levels of cod treated with brine may
approach 0.26%.
†† Some fish are treated with brine, in which case the sodium content is markedly increased. Sodium levels of halibut treated with brine may
approach 0.36%.
††† Some fish are treated with brine, in which case the sodium content is markedly increased. Sodium levels of tuna treated with brine may
approach 0.44%.
‡ Some fish are treated with brine, in which case the sodium content is markedly increased. Sodium levels of canned tuna in water treated with
brine may approach 0.88%.
‡‡ One round tablespoon = 28 g.
Appendix 21. Essential amino acid content of common protein sources.*
Protein Arg Isoleu Leu Lys Met Cys Phe His Thr Trp Val
Meats and fish
Beef 20 1.34 1.02 1.60 1.82 0.54 0.26 0.90 0.60 0.92 0.26 1.06
Chicken 21 1.30 0.97 1.58 1.89 0.57 0.27 0.95 0.40 0.88 0.23 1.01
Cod, raw 18 1.07 0.82 1.45 1.46 0.53 0.19 0.70 0.52 0.78 0.20 0.92
Halibut, raw 21 1.29 0.96 1.69 1.91 0.62 0.22 0.81 0.61 0.91 0.23 1.07
Lamb 18 1.10 0.83 1.30 1.77 0.47 0.23 0.68 0.40 1.13 0.23 0.86
Pork 15 0.89 0.68 1.05 1.44 0.41 0.20 0.57 0.50 0.65 0.17 0.72
Tuna, raw 25 1.40 1.08 1.90 2.14 0.69 0.25 0.91 0.69 1.02 0.26 1.20
Other animal products
Beef stomach 15 1.05 0.63 1.01 1.20 0.36 0.20 0.57 0.40 0.65 0.20 0.75
Heart 17 1.09 0.88 1.55 1.46 0.37 0.27 0.78 0.40 0.78 0.22 0.95
Kidney 16 0.90 0.67 1.25 1.31 0.34 0.22 0.80 0.40 0.67 0.21 0.90
Liver 20 1.06 0.86 1.56 1.70 0.48 0.28 1.00 0.50 0.86 0.26 1.16
Dairy and egg products
Casein 84.4 3.50 5.75 8.84 7.17 2.82 0.31 4.83 2.60 3.93 1.08 6.73
Cottage cheese
Creamed 12.5 0.57 0.73 1.28 1.0 0.38 0.12 0.67 0.41 0.55 0.14 0.77
Low fat (1% fat) 12.4 0.56 0.73 1.27 1.0 0.37 0.11 0.67 0.41 0.55 0.14 0.77
Low fat (2% fat) 13.8 0.63 0.81 1.41 1.11 0.41 0.13 0.74 0.46 0.61 0.15 0.85
Curd (skim) 36 1.28 2.24 3.43 2.72 0.86 0.31 1.70 0.90 1.61 0.49 2.40
Eggs
Egg white 11 0.59 0.62 0.90 0.64 0.39 0.20 0.64 0.24 0.53 0.20 0.86
Egg yolk 16 1.15 0.93 1.36 1.15 0.42 0.26 0.64 0.36 0.90 0.29 1.10
Whole egg 13 0.79 0.73 1.08 0.81 0.42 0.23 0.66 0.26 0.66 0.23 0.98
Whole egg, dried 48 3.02 3.06 4.05 2.94 1.44 1.07 2.66 1.10 2.29 0.76 3.42
Milk
Skim dry milk 36 1.28 2.24 3.43 2.72 0.86 0.31 1.70 0.90 1.61 0.49 2.40
Whole milk 3.5 0.14 0.2 0.36 0.29 0.10 0.04 0.19 0.09 0.18 0.05 0.26
Vegetables
Soybean meal with hulls 44 3.08 2.34 3.46 2.80 0.61 0.67 2.17 1.13 1.74 0.61 2.16
Soybean meal without hulls 50 3.41 2.43 3.73 3.09 0.69 0.74 2.46 1.22 1.92 0.67 2.50
Soybeans 34 2.58 1.95 3.11 2.08 0.64 0.65 2.15 0.91 1.63 0.49 1.93