
Page 8 - Manual FAT EU
P. 8
Manual FAT EU 2018
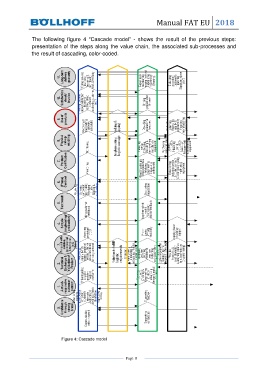
The following figure 4 “Cascade model” - shows the result of the previous steps:
presentation of the steps along the value chain, the associated sub-processes and
the result of cascading, color-coded.
Figure 4: Cascade model
Page 8