
Page 26 - Six Sigma Advanced Tools for Black Belts and Master Black Belts
P. 26
OTE/SPH
OTE/SPH
Char Count= 0
August 31, 2006
JWBK119-01
2:52
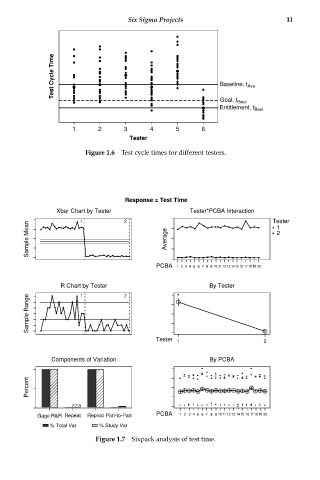
Six Sigma Projects 11
Test Cycle Time Baseline, t Ave
Goal, t Goal
Entitlement, t Best
1 2 3 4 5 6
Tester
Figure 1.6 Test cycle times for different testers.
Response = Test Time
Xbar Chart by Tester 2 Tester*PCBA Interaction Tester
1
Sample Mean Average 1 2
PCBA 1 2 3 4 5 678 9 10 11 12 13 14 15 16 17 18 19 20
R Chart by Tester 2 By Tester
1
Sample Range
Tester 1 2
Components of Variation By PCBA
Percent
Gage R&R Repeat Reprod Part-to-Part PCBA 1 2 3 4 5 67 8 9 10 11 12 13 14 15 16 17 18 19 20
% Total Var % Study Var
Figure 1.7 Sixpack analysis of test time.