
Page 31 - Six Sigma Advanced Tools for Black Belts and Master Black Belts
P. 31
OTE/SPH
OTE/SPH
JWBK119-01
Six Sigma: A Preamble
16 August 31, 2006 2:52 Char Count= 0
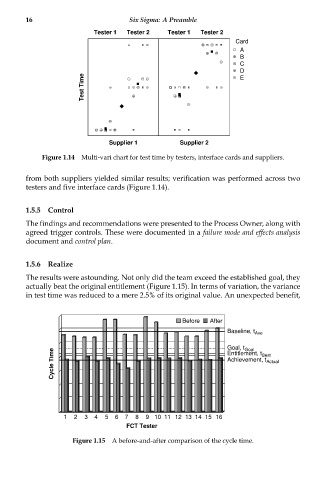
Tester 1 Tester 2 Tester 1 Tester 2
Card
A
B
C
D
Test Time
E
Supplier 1 Supplier 2
Figure 1.14 Multi-vari chart for test time by testers, interface cards and suppliers.
from both suppliers yielded similar results; verification was performed across two
testers and five interface cards (Figure 1.14).
1.5.5 Control
The findings and recommendations were presented to the Process Owner, along with
agreed trigger controls. These were documented in a failure mode and effects analysis
document and control plan.
1.5.6 Realize
The results were astounding. Not only did the team exceed the established goal, they
actually beat the original entitlement (Figure 1.15). In terms of variation, the variance
in test time was reduced to a mere 2.5% of its original value. An unexpected benefit,
Before After
Baseline, t Ave
Goal, t Goal Best
Cycle Time Achievement, t Actual
Entitlement, t
1 2 3 4 5 6 7 8 9 10 11 12 13 14 15 16
FCT Tester
Figure 1.15 A before-and-after comparison of the cycle time.