
Page 30 - Six Sigma Advanced Tools for Black Belts and Master Black Belts
P. 30
OTE/SPH
OTE/SPH
2:52
Char Count= 0
August 31, 2006
JWBK119-01
Six Sigma Projects 15
Applying their engineering knowledge, the team narrowed the cause down to the
transceiver chip on the card. Examination revealed that cards A and D had transceivers
from one supplier, with cards B and C sharing a second transceiver supplier, while
card E had its transceiver from a third supplier. Cross-swapping of the transceiver
with the interface cards confirmed that the difference was due to the transceiver chip.
1.5.4 Improve
During this phase, the effect of four control factors and one noise factor on two re-
sponses was studied.
Response (Y) y 1 : Average Test Time
y 2 : Standard Deviation in Test Time
Control Factors (X) x 1 : Internal Cache
x 2 : External Cache
x 3 : CPU Clock Speed
x 4 : Product Model
Noise Factor (Z) z 1 : Transceiver on Interface Card
4
A2 full factorial design, with two replicates, blocked by the two transceivers, was
employed.
While an optimal combination of control factor levels was identified to minimize
both the mean and variance in test time, the results showed that the noise factor
(transceiver type) was the largest contributor to improvement.
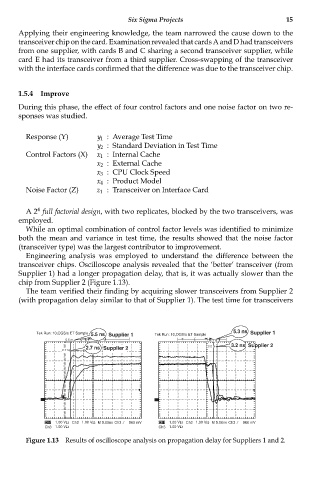
Engineering analysis was employed to understand the difference between the
transceiver chips. Oscilloscope analysis revealed that the ‘better’ transceiver (from
Supplier 1) had a longer propagation delay, that is, it was actually slower than the
chip from Supplier 2 (Figure 1.13).
The team verified their finding by acquiring slower transceivers from Supplier 2
(with propagation delay similar to that of Supplier 1). The test time for transceivers
Tek Run: 10,OGS/s ET Sample 5.3 ns Supplier 1
5.5 ns Supplier 1 Tek Run: 10,OGS/s ET Sample
5.5 m 5.3 m
2.7 ns Supplier 2 3.2 m 3.2 ns Supplier 2
2.7 ns
Ch1 1.00 VΩ Ch2 1.00 VΩ M 5.00ns Ch3 960 mV Ch1 1.00 VΩ Ch2 1.00 VΩ M 5.00ns Ch3 960 mV
Ch3 1.00 VΩ Ch3 1.00 VΩ
Figure 1.13 Results of oscilloscope analysis on propagation delay for Suppliers 1 and 2.