
Page 29 - Six Sigma Advanced Tools for Black Belts and Master Black Belts
P. 29
OTE/SPH
OTE/SPH
JWBK119-01
Six Sigma: A Preamble
14 August 31, 2006 2:52 Char Count= 0
Test Time
Clock Speed (MHz)
Figure 1.11 Nonlinear relationship between test time and clock speed.
an optimal speed for the existing tester design, beyond which value would not be
returned for investment in higher clock speed.
Given the results from the Measure phase, which showed that the variation between
testers was highly significant, the team went on to explore two primary sub-systems
within a tester, namely the interface card and the test fixture. Five interface cards and
six test fixtures were randomly selected for the next experiment; this was to yield
results which came as a pleasant surprise.
Before the experiment, it was believed (from experience) that test fixture would
result in greater inconsistency due to variation in the contact between the test pins
and the test pads, as well as noise due to inductance in the conductors. However,
reviewing the results using a two-way ANOVA Type-II model reveal that the interface
card was the primary cause of variation, not the text fixture.
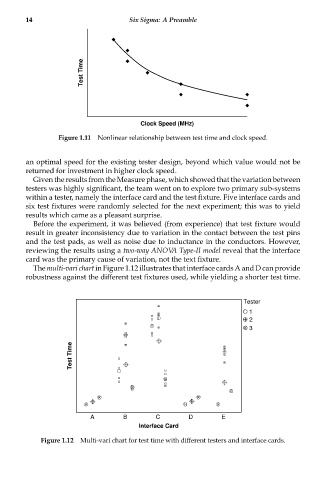
The multi-vari chart in Figure 1.12 illustrates that interface cards A and D can provide
robustness against the different test fixtures used, while yielding a shorter test time.
Tester
1
2
3
Test Time
A B C D E
Interface Card
Figure 1.12 Multi-vari chart for test time with different testers and interface cards.