
Page 27 - Six Sigma Advanced Tools for Black Belts and Master Black Belts
P. 27
OTE/SPH
OTE/SPH
JWBK119-01
Six Sigma: A Preamble
12 August 31, 2006 2:52 Char Count= 0
Response = Handling Time
Xbar Chart by Tester 2 Tester*PCBA Interaction Tester
1
Sample Meen Average 1
2
PCBA 1 2 3 4 5 6 7 8 9 1011121314 1516171819 20
R Chart by Tester 2 By Tester
1
Sample Range
Tester 1 2
Components of Variation By PCBA
Percent
Gage R&R Repeat Reprod Part-to-Part PCBA 1 2 3456789 1011 12 13 14 15 16 1718 19 20
% Total Var % Study Var
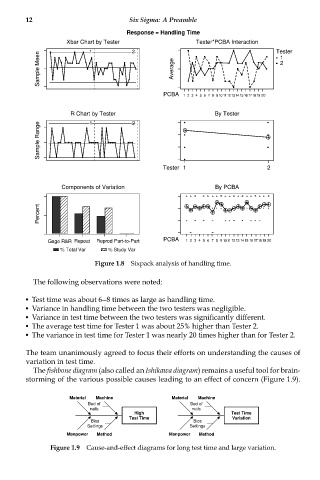
Figure 1.8 Sixpack analysis of handling time.
The following observations were noted:
Test time was about 6--8 times as large as handling time.
Variance in handling time between the two testers was negligible.
Variance in test time between the two testers was significantly different.
The average test time for Tester 1 was about 25% higher than Tester 2.
The variance in test time for Tester 1 was nearly 20 times higher than for Tester 2.
The team unanimously agreed to focus their efforts on understanding the causes of
variation in test time.
The fishbone diagram (also called an Ishikawa diagram) remains a useful tool for brain-
storming of the various possible causes leading to an effect of concern (Figure 1.9).
Material Machine Material Machine
Bed of Bed of
nails nails
High Test Time
Test Time Variation
Bios Bios
Settings Settings
Manpower Method Manpower Method
Figure 1.9 Cause-and-effect diagrams for long test time and large variation.