
Page 28 - Six Sigma Advanced Tools for Black Belts and Master Black Belts
P. 28
OTE/SPH
OTE/SPH
2:52
Char Count= 0
August 31, 2006
JWBK119-01
Six Sigma Projects 13
Table 1.1 Cause-and-effect matrix.
Key process output variables
Key process
input variables High test time Test--time variation Score Rank
w 1 w 2
BIOS settings r 11 r 12 S 1 R 1
. . . . .
. . . . .
. . . . .
Bed-of-nails r k1 r k2 S k R k
However, one of its drawbacks is that generally too many possible causes will be
listed. To facilitate a somewhat objective selection of important causes for further in-
vestigation, the cause-and-effect matrix was employed (Table 1.1). A derivative of the
House of Quality, the importance of the key process output variables -- high mean and
variance in test time -- were reflected in the different weights assigned to them.
The measure s ij reflects the relationship between a key process input variable i and
the key process output variable j. The score of each input variable, S i = r i1 w 1 + r i2 w 2 ,
was computed and ranked in descending order (i.e. highest score first), with further
statistical analysis to be performed on the shortlisted input variables, selected via a
Pareto chart.
At the end of this phase, the team were confident that they had the solution to their
challenge, but they were surprised by what they were to learn.
1.5.3 Analyze
During this phase, statistical experiments and analyses were performed to verify the
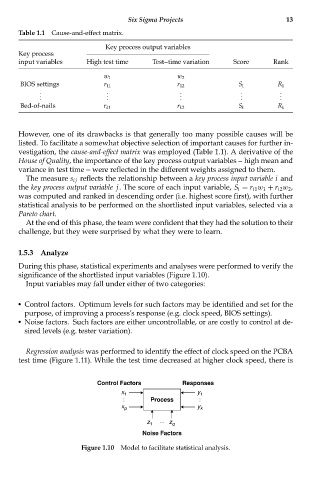
significance of the shortlisted input variables (Figure 1.10).
Input variables may fall under either of two categories:
Control factors. Optimum levels for such factors may be identified and set for the
purpose, of improving a process’s response (e.g. clock speed, BIOS settings).
Noise factors. Such factors are either uncontrollable, or are costly to control at de-
sired levels (e.g. tester variation).
Regression analysis was performed to identify the effect of clock speed on the PCBA
test time (Figure 1.11). While the test time decreased at higher clock speed, there is
Control Factors Responses
x 1 y 1
Process
x p y k
z 1 z q
Noise Factors
Figure 1.10 Model to facilitate statistical analysis.