
Page 334 - Six Sigma Advanced Tools for Black Belts and Master Black Belts
P. 334
OTE/SPH
OTE/SPH
3:6
Char Count= 0
August 31, 2006
JWBK119-20
Example 2 319
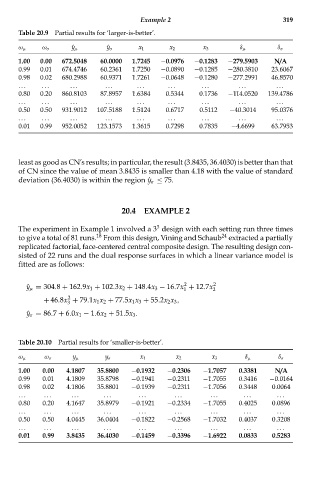
Table 20.9 Partial results for ‘larger-is-better’.
ω μ ω σ ˆ y μ ˆ y σ x 1 x 2 x 3 δ μ δ σ
1.00 0.00 672.5048 60.0000 1.7245 −0.0976 −0.1283 −279.5903 N/A
0.99 0.01 674.4746 60.2361 1.7250 −0.0890 −0.1285 −280.3810 23.6067
0.98 0.02 680.2988 60.9371 1.7261 −0.0648 −0.1280 −277.2991 46.8570
... ... ... ... ... ... ... ... ...
0.80 0.20 860.8103 87.8957 1.6384 0.5344 0.1736 −114.0520 139.4786
... ... ... ... ... ... ... ... ...
0.50 0.50 931.9012 107.5188 1.5124 0.6717 0.5112 −40.3014 95.0376
... ... ... ... ... ... ... ... ...
0.01 0.99 952.0052 123.1573 1.3615 0.7298 0.7835 −4.6699 63.7953
least as good as CN’s results; in particular, the result (3.8435, 36.4030) is better than that
of CN since the value of mean 3.8435 is smaller than 4.18 with the value of standard
deviation (36.4030) is within the region ˆy σ ≤ 75.
20.4 EXAMPLE 2
3
The experiment in Example 1 involved a 3 design with each setting run three times
18
24
to give a total of 81 runs. From this design, Vining and Schaub extracted a partially
replicated factorial, face-centered central composite design. The resulting design con-
sisted of 22 runs and the dual response surfaces in which a linear variance model is
fitted are as follows:
2
ˆ y μ = 304.8 + 162.9x 1 + 102.3x 2 + 148.4x 3 − 16.7x + 12.7x 2
1 2
2
+ 46.8x + 79.1x 1 x 2 + 77.5x 1 x 3 + 55.2x 2 x 3 ,
3
ˆ y σ = 86.7 + 6.0x 1 − 1.6x 2 + 51.5x 3 .
Table 20.10 Partial results for ‘smaller-is-better’.
ω μ ω σ y μ y σ x 1 x 2 x 3 δ μ δ σ
1.00 0.00 4.1807 35.8800 −0.1932 −0.2306 −1.7057 0.3381 N/A
0.99 0.01 4.1809 35.8798 −0.1941 −0.2311 −1.7055 0.3416 −0.0164
0.98 0.02 4.1806 35.8801 −0.1939 −0.2311 −1.7056 0.3448 0.0064
... ... ... ... ... ... ... ... ...
0.80 0.20 4.1647 35.8979 −0.1921 −0.2334 −1.7055 0.4025 0.0896
... ... ... ... ... ... ... ... ...
0.50 0.50 4.0445 36.0404 −0.1822 −0.2568 −1.7032 0.4037 0.3208
... ... ... ... ... ... ... ... ...
0.01 0.99 3.8435 36.4030 −0.1459 −0.3396 −1.6922 0.0833 0.5283