
Page 331 - Six Sigma Advanced Tools for Black Belts and Master Black Belts
P. 331
OTE/SPH
OTE/SPH
3:6
August 31, 2006
JWBK119-20
Char Count= 0
316 A Unified Approach for Dual Response Surface Optimization
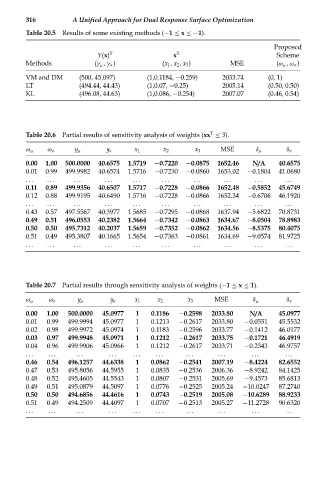
Table 20.5 Results of some existing methods (−1 ≤ x ≤−1).
Proposed
Y(x) T x T Scheme
Methods (γ μ ,γ σ ) (x 1 , x 2 , x 3 ) MSE (ω μ ,ω σ )
VM and DM (500, 45.097) (1,0.1184, −0.259) 2033.74 (0, 1)
LT (494.44, 44.43) (1,0.07, −0.25) 2005.14 (0.50, 0.50)
KL (496.08, 44.63) (1,0.086, −0.254) 2007.07 (0.46, 0.54)
T
Table 20.6 Partial results of sensitivity analysis of weights (xx ≤ 3).
MSE
ω μ ω σ y μ y σ x 1 x 2 x 3 δ μ δ σ
0.00 1.00 500.0000 40.6575 1.5719 −0.7220 −0.0875 1652.46 N/A 40.6575
0.01 0.99 499.9982 40.6574 1.5716 −0.7230 −0.0860 1653.02 −0.1804 41.0680
... ... ... ... ... ... ... ... ... ...
0.11 0.89 499.9356 40.6507 1.5717 −0.7228 −0.0866 1652.48 −0.5852 45.6749
0.12 0.88 499.9195 40.6490 1.5716 −0.7228 −0.0866 1652.34 −0.6706 46.1920
... ... ... ... ... ... ... ... ... ...
0.43 0.57 497.5567 40.3977 1.5685 −0.7295 −0.0868 1637.94 −5.6822 70.8731
0.49 0.51 496.0553 40.2382 1.5664 −0.7342 −0.0863 1634.67 −8.0504 78.8983
0.50 0.50 495.7312 40.2037 1.5659 −0.7352 −0.0862 1634.56 −8.5375 80.4075
0.51 0.49 495.3807 40.1665 1.5654 −0.7363 −0.0861 1634.69 −9.0574 81.9725
... ... ... ... ... ... ... ... ... ...
Table 20.7 Partial results through sensitivity analysis of weights (−1 ≤ x ≤ 1).
MSE
ω μ ω σ y μ y σ x 1 x 2 x 3 δ μ δ σ
0.00 1.00 500.0000 45.0977 1 0.1186 −0.2598 2033.80 N/A 45.0977
0.01 0.99 499.9994 45.0977 1 0.1213 −0.2617 2033.80 −0.0551 45.5532
0.02 0.98 499.9972 45.0974 1 0.1183 −0.2596 2033.77 −0.1412 46.0177
0.03 0.97 499.9948 45.0971 1 0.1212 −0.2617 2033.75 −0.1721 46.4919
0.04 0.96 499.9906 45.0966 1 0.1212 −0.2617 2033.71 −0.2343 46.9757
... ... ... ... ... ... ... ... ... ...
0.46 0.54 496.1257 44.6338 1 0.0862 −0.2541 2007.19 −8.4224 82.6552
0.47 0.53 495.8056 44.5955 1 0.0835 −0.2536 2006.36 −8.9242 84.1425
0.48 0.52 495.4605 44.5543 1 0.0807 −0.2531 2005.69 −9.4573 85.6813
0.49 0.51 495.0879 44.5097 1 0.0776 −0.2525 2005.24 −10.0247 87.2740
0.50 0.50 494.6856 44.4616 1 0.0743 −0.2519 2005.08 −10.6289 88.9233
0.51 0.49 494.2509 44.4097 1 0.0707 −0.2513 2005.27 −11.2728 90.6320
... ... ... ... ... ... ... ... ... ...