
Page 362 - Six Sigma Advanced Tools for Black Belts and Master Black Belts
P. 362
OTE/SPH
OTE/SPH
3:7
Char Count= 0
JWBK119-22
August 31, 2006
ARL Performance 347
chart to detect a change in the mean of an AR(1) process. The shift in the mean is
expressed in terms of σ x ,
σ ε 2
σ x = 2 ,
1 − φ 1
where φ 1 represents the autoregressive parameter. Each simulation run is composed
of 5000 iterations. The required ARMA process is generated using the innovation
algorithm, 13 while the sequence of iid normal random variables is generated using
the IMSL 20 Statistical Library. For comparison purposes, all the control limits of the
MH chart in the following are chosen such that the in-control ARL is approximately
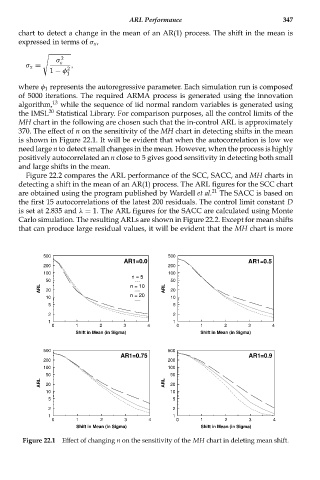
370. The effect of n on the sensitivity of the MH chart in detecting shifts in the mean
is shown in Figure 22.1. It will be evident that when the autocorrelation is low we
need large n to detect small changes in the mean. However, when the process is highly
positively autocorrelated an n close to 5 gives good sensitivity in detecting both small
and large shifts in the mean.
Figure 22.2 compares the ARL performance of the SCC, SACC, and MH charts in
detecting a shift in the mean of an AR(1) process. The ARL figures for the SCC chart
are obtained using the program published by Wardell et al. 21 The SACC is based on
the first 15 autocorrelations of the latest 200 residuals. The control limit constant D
is set at 2.835 and λ = 1. The ARL figures for the SACC are calculated using Monte
Carlo simulation. The resulting ARLs are shown in Figure 22.2. Except for mean shifts
that can produce large residual values, it will be evident that the MH chart is more
500 500
AR1=0.0 AR1=0.5
200 200
100 100
50 n = 5 50
ARL 20 n = 10 ARL 20
10 n = 20 10
5 5
2 2
1 1
0 1 2 3 4 0 1 2 3 4
Shift in Mean (in Sigma) Shift in Mean (in Sigma)
500 500
AR1=0.75 AR1=0.9
200 200
100 100
50 50
ARL 20 ARL 20
10 10
5 5
2 2
1 1
0 1 2 3 4 0 1 2 3 4
Shift in Mean (in Sigma) Shift in Mean (in Sigma)
Figure 22.1 Effect of changing n on the sensitivity of the MH chart in deleting mean shift.