
Page 363 - Six Sigma Advanced Tools for Black Belts and Master Black Belts
P. 363
OTE/SPH
OTE/SPH
Char Count= 0
3:7
August 31, 2006
JWBK119-22
348 Simultaneous Monitoring of the Mean, Variance and Autocorrelation
500 500
AR1=0.0 AR1=0.5
200 200
100 100
50 50
ARL 20 ARL 20
10 SACC 10
5 MH (5) 5
SCC
2 2
1 1
0 1 2 3 4 0 1 2 3 4
Shift in Mean (in Sigma) Shift in Mean (in Sigma)
500 500
AR1=0.75 AR1=0.9
200 200
100 100
50 50
ARL 20 ARL 20
10 10
5 5
2 2
1 1
0 1 2 3 4 0 1 2 3 4
Shift in Mean (in Sigma) Shift in Mean (in Sigma)
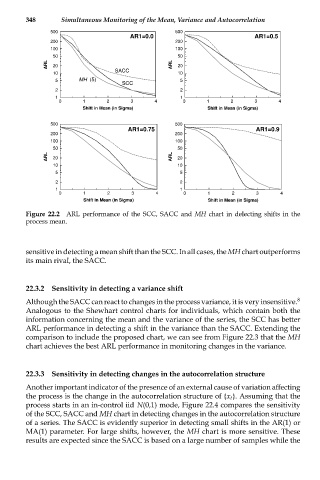
Figure 22.2 ARL performance of the SCC, SACC and MH chart in delecting shifts in the
process mean.
sensitive in detecting a mean shift than the SCC. In all cases, the MH chart outperforms
its main rival, the SACC.
22.3.2 Sensitivity in detecting a variance shift
Although the SACC can react to changes in the process variance, it is very insensitive. 8
Analogous to the Shewhart control charts for individuals, which contain both the
information concerning the mean and the variance of the series, the SCC has better
ARL performance in detecting a shift in the variance than the SACC. Extending the
comparison to include the proposed chart, we can see from Figure 22.3 that the MH
chart achieves the best ARL performance in monitoring changes in the variance.
22.3.3 Sensitivity in detecting changes in the autocorrelation structure
Another important indicator of the presence of an external cause of variation affecting
the process is the change in the autocorrelation structure of {x t }. Assuming that the
process starts in an in-control iid N(0,1) mode, Figure 22.4 compares the sensitivity
of the SCC, SACC and MH chart in detecting changes in the autocorrelation structure
of a series. The SACC is evidently superior in detecting small shifts in the AR(1) or
MA(1) parameter. For large shifts, however, the MH chart is more sensitive. These
results are expected since the SACC is based on a large number of samples while the