Page 365 - Six Sigma Advanced Tools for Black Belts and Master Black Belts
P. 365

OTE/SPH
 OTE/SPH
                         3:7
          August 31, 2006
                              Char Count= 0
 JWBK119-22
        350       Simultaneous Monitoring of the Mean, Variance and Autocorrelation
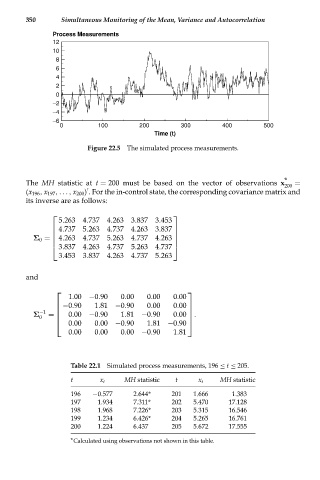
               Process Measurements
               12
               10
                8
                6
                4
                2
                0
               −2
               −4
               −6
                 0         100         200        300        400        500
                                           Time (t)
                         Figure 22.5 The simulated process measurements.


        The MH statistic at t = 200 must be based on the vector of observations x *  =
                                                                              200

        (x 196 , x 197 ,..., x 200 ) . For the in-control state, the corresponding covariance matrix and
        its inverse are as follows:

                 5.263 4.737  4.263 3.837 3.453
               ⎡                                ⎤
                 4.737 5.263 4.737 4.263 3.837
               ⎢                                ⎥
               ⎢                                ⎥
          Σ 0 =  ⎢ 4.263 4.737 5.263 4.737 4.263  ⎥
               ⎢                                ⎥
               ⎣ 3.837 4.263 4.737 5.263 4.737 ⎦
                 3.453 3.837 4.263 4.737 5.263
        and


                    1.00  −0.90   0.00   0.00   0.00
                ⎡                                   ⎤
                  −0.90    1.81 −0.90    0.00   0.00
                ⎢                                   ⎥
          Σ −1  =  ⎢  0.00  −0.90  1.81 −0.90   0.00  ⎥ .
            0
                                                    ⎥
                ⎢
                                                    ⎥
                ⎢
                ⎣ 0.00     0.00 −0.90    1.81 −0.90 ⎦
                    0.00   0.00   0.00 −0.90    1.81
                    Table 22.1 Simulated process measurements, 196 ≤ t ≤ 205.
                    t       x t    MH statistic  t     x t  MH statistic
                    196   −0.577     2.644*    201   1.666      1.383
                    197    1.934     7.311*    202   5.470     17.128
                    198    1.968     7.226*    203   5.315     16.546
                    199    1.234     6.426*    204   5.265     16.761
                    200    1.224     6.437     205   5.672     17.555
                    *Calculated using observations not shown in this table.
   360   361   362   363   364   365   366   367   368   369   370