
Page 204 - Department of Social Development Annual Report 2021
P. 204
PART D: HUMAN RESOURCE MANAGEMENT
HUMAN RESOURCE OVERSIGHT STATISTICS
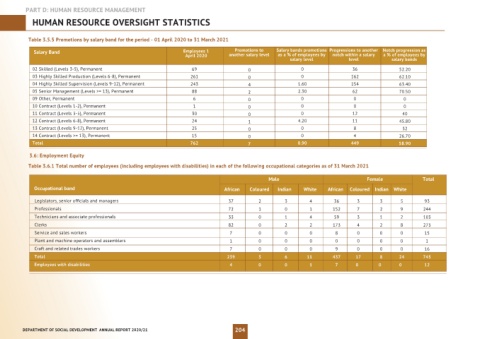
Table 3.5.5 Promotions by salary band for the period - 01 April 2020 to 31 March 2021
Salary Band Employees 1 Promotions to Salary bands promotions Progressions to another Notch progression as
April 2020 another salary level as a % of employees by notch within a salary a % of employees by
salary level level salary bands
02 Skilled (Levels 3-5), Permanent 69 0 0 36 52.20
03 Highly Skilled Production (Levels 6-8), Permanent 261 0 0 162 62.10
04 Highly Skilled Supervision (Levels 9-12), Permanent 243 4 1.60 154 63.40
05 Senior Management (Levels >= 13), Permanent 88 2 2.30 62 70.50
09 Other, Permanent 6 0 0 0 0
10 Contract (Levels 1-2), Permanent 1 0 0 0 0
11 Contract (Levels 3-5), Permanent 30 0 0 12 40
12 Contract (Levels 6-8), Permanent 24 1 4.20 11 45.80
13 Contract (Levels 9-12), Permanent 25 0 0 8 32
14 Contract (Levels >= 13), Permanent 15 0 0 4 26.70
Total 762 7 0.90 449 58.90
3.6: Employment Equity
Table 3.6.1 Total number of employees (including employees with disabilities) in each of the following occupational categories as of 31 March 2021
Male Female Total
Occupational band African Coloured Indian White African Coloured Indian White
Legislators, senior officials and managers 37 2 3 4 36 3 3 5 93
Professionals 72 1 0 1 152 7 2 9 244
Technicians and associate professionals 33 0 1 4 59 3 1 2 103
Clerks 82 0 2 2 173 4 2 8 273
Service and sales workers 7 0 0 0 8 0 0 0 15
Plant and machine operators and assemblers 1 0 0 0 0 0 0 0 1
Craft and related trades workers 7 0 0 0 9 0 0 0 16
Total 239 3 6 11 437 17 8 24 745
Employees with disabilities 4 0 0 1 7 0 0 0 12
DEPARTMENT OF SOCIAL DEVELOPMENT ANNUAL REPORT 2020/21 204