Page 205 - Department of Social Development Annual Report 2021
P. 205

PART D: HUMAN RESOURCE MANAGEMENT

             HUMAN RESOURCE OVERSIGHT STATISTICS


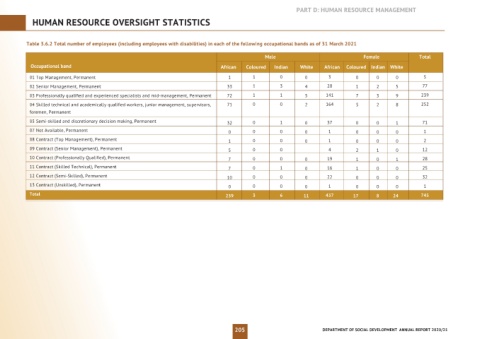
          Table 3.6.2 Total number of employees (including employees with disabilities) in each of the following occupational bands as of 31 March 2021

                                                                                              Male                               Female             Total
            Occupational band                                                 African        Coloured      Indian         White      African     Coloured    Indian    White
           01 Top Management, Permanent                                          1        1        0        0       3         0      0      0         5
           02 Senior Management, Permanent                                       33       1        3        4       28        1      2      5        77
           03 Professionally qualified and experienced specialists and mid-management, Permanent  72  1  1   5      141        7      3      9        239
           04 Skilled technical and academically qualified workers, junior management, supervisors,   71  0  0  2   164        5      2      8        252
           foremen, Permanent
           05 Semi-skilled and discretionary decision making, Permanent          32       0        1        0       37        0      0      1        71
           07 Not Available, Permanent                                           0        0        0        0       1         0      0      0         1
           08 Contract (Top Management), Permanent                               1        0        0        0       1         0      0      0         2
           09 Contract (Senior Management), Permanent                            5        0        0                4         2      1      0        12
           10 Contract (Professionally Qualified), Permanent                      7        0        0        0       19        1      0      1        28
           11 Contract (Skilled Technical), Permanent                            7        0        1        0       16        1      0      0        25
           12 Contract (Semi-Skilled), Permanent                                 10       0        0        0       22        0      0      0        32
           13 Contract (Unskilled), Permanent                                    0        0        0        0       1         0      0      0         1
           Total                                                                239       3        6        11     437       17      8     24        745


                                                                                   205                            DEPARTMENT OF SOCIAL DEVELOPMENT  ANNUAL REPORT 2020/21
   200   201   202   203   204   205   206   207   208   209   210