Page 210 - Department of Social Development Annual Report 2021
P. 210

PART D: HUMAN RESOURCE MANAGEMENT

             HUMAN RESOURCE OVERSIGHT STATISTICS


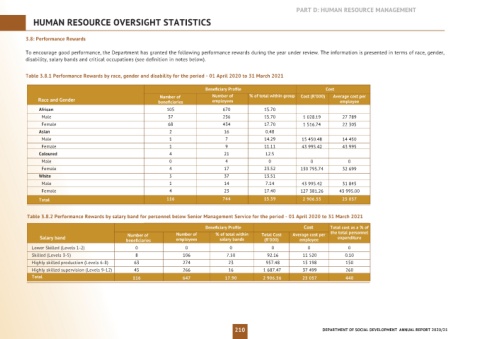
          3.8: Performance Rewards

          To encourage good performance, the Department has granted the following performance rewards during the year under review. The information is presented in terms of race, gender,
          disability, salary bands and critical occupations (see definition in notes below).


          Table 3.8.1 Performance Rewards by race, gender and disability for the period - 01 April 2020 to 31 March 2021

                                                                         Beneficiary Profile                         Cost
                                                         Number of
              Race and Gender                            beneficiaries      Number of    % of total within group  Cost (R’000)  Average cost per
                                                                           employees
                                                                                                                        employee
               African                                     105                 670            15.70
                 Male                                       37                 236            15.70        1 028.19      27 789
                 Female                                     68                 434            17.70        1 516.74      22 305
               Asian                                        2                   16            0.48
                 Male                                       1                   7             14.29        15 450.48     14 450
                 Female                                     1                   9             11.11        43 995.42     43 995
               Coloured                                     4                   21            12.5
                 Male                                       0                   4              0              0            0
                 Female                                     4                   17            23.52       130 795.74     32 699
               White                                        5                   37            13.51
                 Male                                       1                   14            7.14         43 995.42     31 845
                 Female                                     4                   23            17.40       127 381.26    43 995.00
               Total                                       116                 744            15.59        2 906.55      25 057


          Table 3.8.2 Performance Rewards by salary band for personnel below Senior Management Service for the period - 01 April 2020 to 31 March 2021
                                                                         Beneficiary Profile                  Cost     Total cost as a % of
                                              Number of
               Salary band                   beneficiaries      Number of     % of total within   Total Cost   Average cost per   the total personnel
                                                                                                                       expenditure
                                                                              salary bands
                                                               employees
                                                                                              (R’000)
                                                                                                          employee
            Lower Skilled (Levels 1-2)          0                 0                0             0           0             0
            Skilled (Levels 3-5)                8                106              7.50          92.16       11 520        0.10
            Highly skilled production (Levels 6-8)  63           274              23           957.48       15 198        150
            Highly skilled supervision (Levels 9-12)  45         266              16          1 687.47      37 499        260
            Total                               116              647             17.90        2 906.56      25 057        440


                                                                                   210                            DEPARTMENT OF SOCIAL DEVELOPMENT  ANNUAL REPORT 2020/21
   205   206   207   208   209   210   211   212   213   214   215