Page 233 - Quantitative Data Analysis
P. 233

Quantitative Data Analysis
                                              Simply Explained Using SPSS


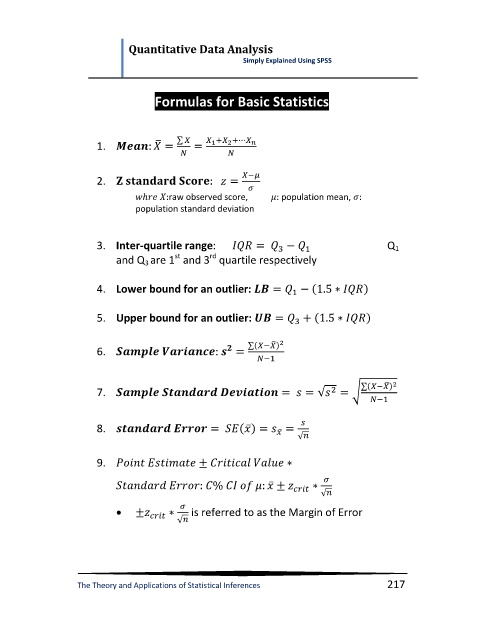
                              Formulas for Basic Statistics


                              ̅
                   1.             ∑                       


                                                −
                   2.

                                 raw observed score,      population mean,
                          population standard deviation


                   3.  Inter-quartile range:                             Q 1


                                  st
                                        rd
                       and Q 3 are 1  and 3  quartile respectively

                   4.  Lower bound for an outlier:


                   5.  Upper bound for an outlier:


                   6.                          ∑   −   ̅
                                                  −

                   7.                                   √    √      ∑   −   ̅

                                                                       −


                   8.                        ̅
                                                     ̅
                                                        √

                   9.

                                                    ̅
                                                             √

                                      is referred to as the Margin of Error
                                  √


               The Theory and Applications of Statistical Inferences           217
   228   229   230   231   232   233   234   235   236   237   238