
Page 234 - Quantitative Data Analysis
P. 234
Quantitative Data Analysis
Simply Explained Using SPSS
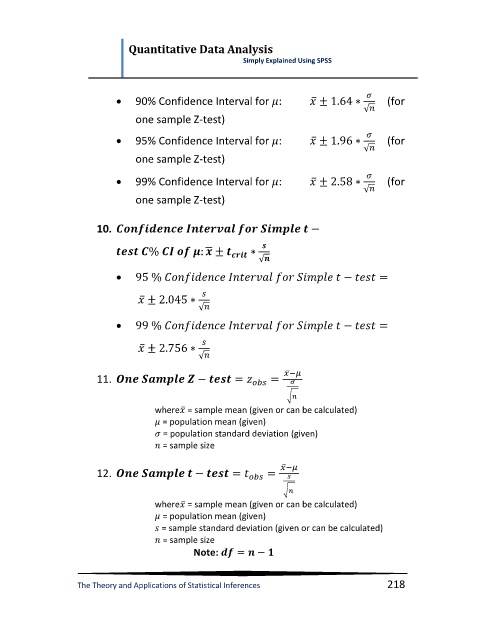
90% Confidence Interval for : ̅ (for
√
one sample Z-test)
95% Confidence Interval for : ̅ (for
√
one sample Z-test)
99% Confidence Interval for : ̅ (for
√
one sample Z-test)
10.
̅
√
̅
√
̅
√
̅−
11.
√
where ̅ = sample mean (given or can be calculated)
= population mean (given)
= population standard deviation (given)
= sample size
̅−
12.
√
where ̅ = sample mean (given or can be calculated)
= population mean (given)
= sample standard deviation (given or can be calculated)
= sample size
Note:
The Theory and Applications of Statistical Inferences 218