
Page 16 - H:\Annual Report\
P. 16
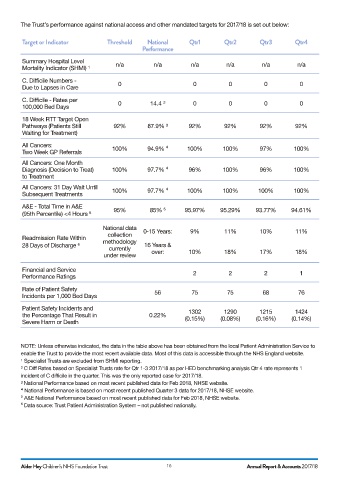
The Trust’s performance against national access and other mandated targets for 2017/18 is set out below:

         Target or Indicator           Threshold     National      Qtr1         Qtr2        Qtr3         Qtr4
                                                   Performance

         Summary Hospital Level
         Mortality Indicator (SHMI) ¹     n/a          n/a          n/a         n/a          n/a         n/a

         C. Difficile Numbers -
                                           0                         0           0            0           0
         Due to Lapses in Care

         C. Difficile - Rates per
                                           0          14.4 ²         0           0            0           0
         100,000 Bed Days
         18 Week RTT Target Open
         Pathways (Patients Still        92%         87.9% ³       92%          92%         92%          92%
         Waiting for Treatment)
         All Cancers:
                                        100%         94.9% ⁴       100%        100%         97%         100%
         Two Week GP Referrals
         All Cancers: One Month
         Diagnosis (Decision to Treat)   100%        97.7% ⁴       96%         100%         96%         100%
         to Treatment

         All Cancers: 31 Day Wait Until
                                        100%         97.7% ⁴       100%        100%         100%        100%
         Subsequent Treatments
         A&E - Total Time in A&E                          ₅
         (95th Percentile) <4 Hours  ₅   95%          85%         95.97%      95.29%       93.77%      94.61%


                                     National data
                                                   0-15 Years:      9%          11%         10%          11%
                                       collection
         Readmission Rate Within
                            ₆        methodology
         28 Days of Discharge                       16 Years &
                                       currently
                                                      over:        10%          18%         17%          18%
                                     under review
         Financial and Service                                       2           2            2           1
         Performance Ratings

         Rate of Patient Safety                        56           75           75          68           76
         Incidents per 1,000 Bed Days

         Patient Safety Incidents and
                                                                   1302         1290        1215         1424
         the Percentage That Result in               0.22%
                                                                  (0.15%)     (0.08%)      (0.16%)     (0.14%)
         Severe Harm or Death


        NOTE: Unless otherwise indicated, the data in the table above has been obtained from the local Patient Administration Service to
        enable the Trust to provide the most recent available data. Most of this data is accessible through the NHS England website.
        ¹ Specialist Trusts are excluded from SHMI reporting.
        ² C Diff Rates based on Specialist Trusts rate for Qtr 1-3 2017/18 as per HED benchmarking analysis Qtr 4 rate represents 1
        incident of C difficile in the quarter. This was the only reported case for 2017/18.
        ³ National Performance based on most recent published data for Feb 2018, NHSE website.
        ₄
          National Performance is based on most recent published Quarter 3 data for 2017/18, NHSE website.
        ⁵ A&E National Performance based on most recent published data for Feb 2018, NHSE website.
        ⁶ Data source: Trust Patient Administration System – not published nationally.


        Alder Hey Children’s NHS Foundation Trust           16                          Annual Report & Accounts 2017/18