
Page 10 - Data Visualization aligned
P. 10
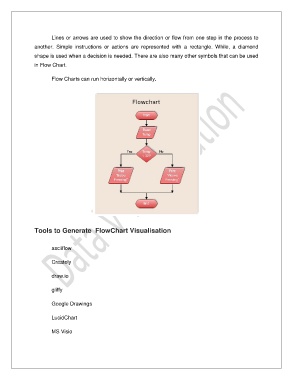
Lines or arrows are used to show the direction or flow from one step in the process to
               another.  Simple  instructions  or  actions  are  represented  with  a  rectangle.  While,  a  diamond

               shape is used when a decision is needed. There are also many other symbols that can be used
               in Flow Chart.


                       Flow Charts can run horizontally or vertically.


               Tools to Generate  FlowChart Visualisation


                       asciiflow


                       Creately

                       draw.io


                       gliffy

                       Google Drawings


                       LucidChart


                       MS Visio