
Page 25 - Data Visualization aligned
P. 25
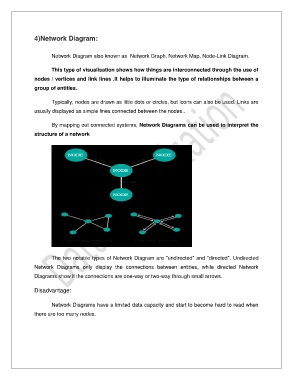
4)Network Diagram:


                       Network Diagram also known as  Network Graph, Network Map, Node-Link Diagram.

                       This type of visualisation shows how things are interconnected through the use of

               nodes / vertices and link lines .It helps to illuminate the type of relationships between a
               group of entities.


                       Typically, nodes are drawn as little dots or circles, but icons can also be used. Links are
               usually displayed as simple lines connected between the nodes..


                       By mapping out connected systems, Network Diagrams can be used to interpret the
               structure of a network


                       The two notable types of Network Diagram are "undirected" and "directed". Undirected

               Network  Diagrams  only  display  the  connections  between  entities,  while  directed  Network
               Diagrams show if the connections are one-way or two-way through small arrows.


               Disadvantage:


                       Network Diagrams have a limited data capacity and start to become hard to read when
               there are too many nodes.