
Page 22 - Data Visualization aligned
P. 22
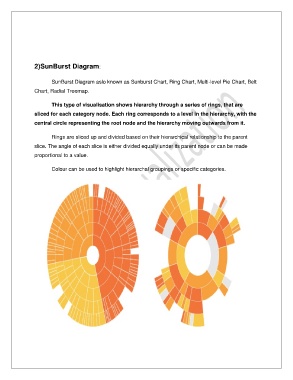
2)SunBurst Diagram:

                       SunBurst Diagram aslo known as Sunburst Chart, Ring Chart, Multi-level Pie Chart, Belt

               Chart, Radial Treemap.

                       This type of visualisation shows hierarchy through a series of rings, that are

               sliced for each category node. Each ring corresponds to a level in the hierarchy, with the
               central circle representing the root node and the hierarchy moving outwards from it.


                       Rings are sliced up and divided based on their hierarchical relationship to the parent
               slice. The angle of each slice is either divided equally under its parent node or can be made

               proportional to a value.

                       Colour can be used to highlight hierarchal groupings or specific categories.