
Page 21 - Data Visualization aligned
P. 21
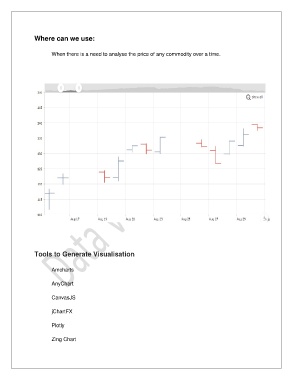
Where can we use:


                       When there is a need to analyse the price of any commodity over a time.


               Tools to Generate Visualisation


                       Amcharts

                       AnyChart


                       CanvasJS

                       jChartFX


                       Plotly


                       Zing Chart