
Page 23 - Data Visualization aligned
P. 23
Tools to Generate Visualisation
Aculocity
D3
JavaScript InfoVis Toolkit
Protovis, RAWGraphs
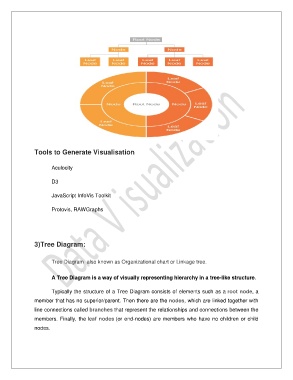
3)Tree Diagram:
Tree Diagram also known as Organizational chart or Linkage tree.
A Tree Diagram is a way of visually representing hierarchy in a tree-like structure.
Typically the structure of a Tree Diagram consists of elements such as a root node, a
member that has no superior/parent. Then there are the nodes, which are linked together with
line connections called branches that represent the relationships and connections between the
members. Finally, the leaf nodes (or end-nodes) are members who have no children or child
nodes.