
Page 19 - Data Visualization aligned
P. 19
Google Docs
RAW
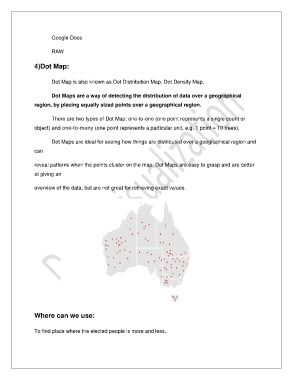
4)Dot Map:
Dot Map is also known as Dot Distribution Map, Dot Density Map.
Dot Maps are a way of detecting the distribution of data over a geographical
region, by placing equally sized points over a geographical region.
There are two types of Dot Map: one-to-one (one point represents a single count or
object) and one-to-many (one point represents a particular unit, e.g. 1 point = 10 trees).
Dot Maps are ideal for seeing how things are distributed over a geographical region and
can
reveal patterns when the points cluster on the map. Dot Maps are easy to grasp and are better
at giving an
overview of the data, but are not great for retrieving exact values.
Where can we use:
To find place where the elected people is more and less.