
Page 17 - Data Visualization aligned
P. 17
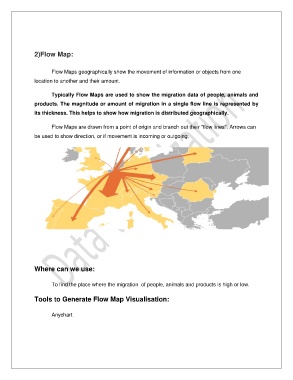
2)Flow Map:


                       Flow Maps geographically show the movement of information or objects from one
               location to another and their amount.


                       Typically Flow Maps are used to show the migration data of people, animals and
               products. The magnitude or amount of migration in a single flow line is represented by

               its thickness. This helps to show how migration is distributed geographically.

                       Flow Maps are drawn from a point of origin and branch out their "flow lines". Arrows can

               be used to show direction, or if movement is incoming or outgoing.


               Where can we use:


                       To find the place where the migration  of people, animals and products is high or low.


               Tools to Generate Flow Map Visualisation:


                       Anychart